エージェントタイムラインの詳細ビュー
以下の権限
- ui > supervisorAgentDetails > view
- ディレクトリ>ユーザー>ビュー
- 分析>ユーザー詳細>ビュー
タイムラインのインタラクション部分を表示するには:
- 分析>会話集約>ビュー
- 分析>会話の詳細>ビュー
メトリックを選択するには、次のいずれかが必要です。
- 分析>ユーザー集計>ビュー
- 分析>会話集約>ビュー
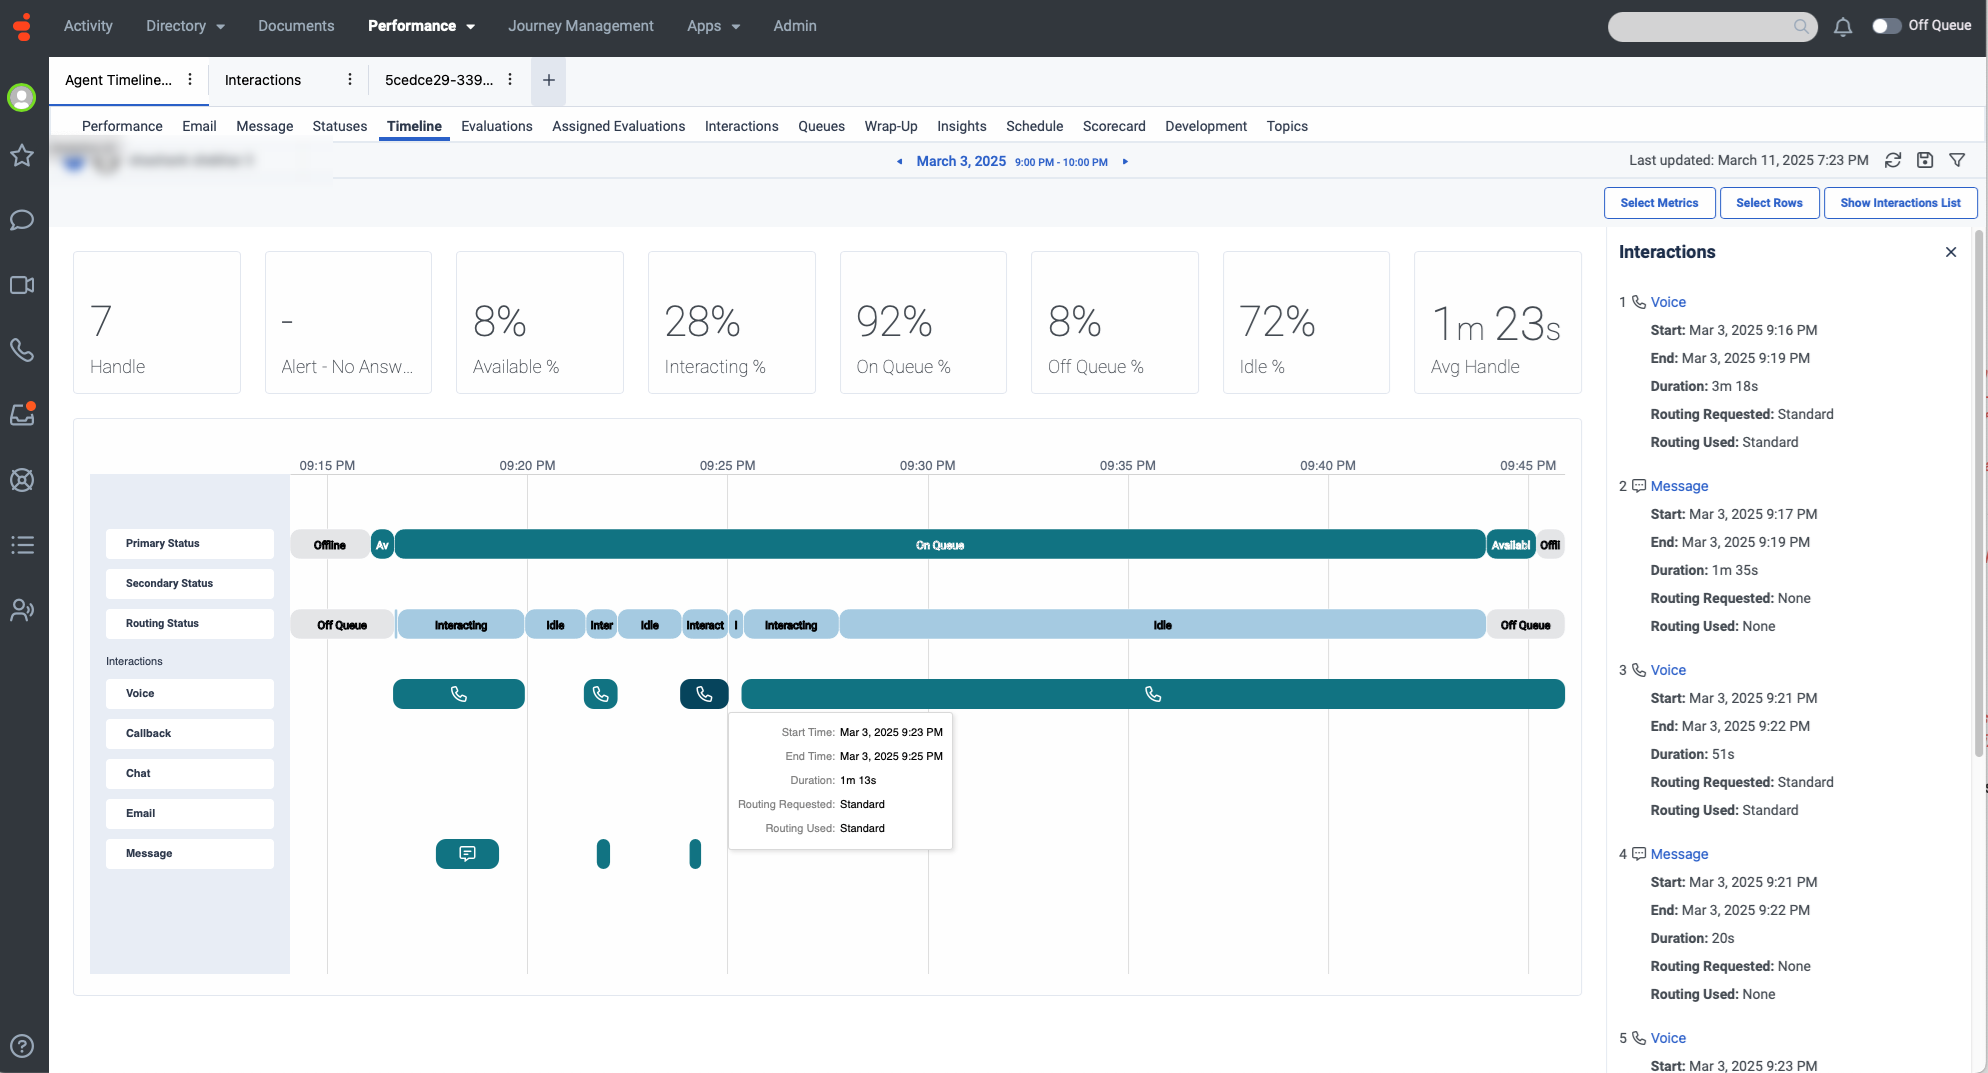
エージェント タイムラインの詳細ビューでは、エージェントが処理した会話の詳細な視覚的表現が提供されます。このビューにより、スーパーバイザーはエージェントのアクティビティをより詳細に把握できるようになります。スーパーバイザーは、エージェントが処理する音声会話のシーケンスが、複数の同時デジタルインタラクションの重なりとどのように織り交ぜられているかを確認できます。
デフォルトでは、このビューには、プライマリ ステータス、セカンダリ ステータス、ルーティング ステータス、音声、コールバック、チャット、電子メール、メッセージなどのさまざまなインタラクションに関する詳細が表示されます。
エージェントのタイムラインの詳細を表示するには:
- パフォーマンス>ワークスペース>Contact Center>エージェントのパフォーマンスをクリックします。
- クリックメニュー > 分析>分析ワークスペース>コンタクトセンター>エージェントのパフォーマンス。
- からエージェントパフォーマンス概要ビュー、エージェント名をクリックします。エージェントのパフォーマンス詳細ビューが表示されます。
- クリックタイムラインタブ。エージェント タイムラインの詳細ビューが表示されます。
最新のデータを表示するには、更新するをクリックしてください。
にビューを保存する、 クリックビューを保存。
タイムラインの時間範囲を拡大したり縮小したりできます。たとえば、日付ピッカーでは 3 月 3 日の午後 9 時から午後 10 時までの時間間隔が選択されていることがわかります。ただし、タイムラインは午後 9 時 15 分直前と午後 9 時 45 分直後に拡大表示されます。ズームアウトすると、午後 9 時から午後 10 時までの 1 時間全体を見ることができます。1 時間未満にズームインした場合は、左側の午後 9 時の境界と右側の午後 10 時の境界まで水平にスクロールできます。
Windows OS システムで拡大/縮小するには、Control (Ctrl) キーを押しながらマウスまたはトラックパッドでスクロールします。Windows OS システムで水平方向にスクロールするには、トラックパッドを使用できます。
Mac OS システムで拡大/縮小するには、コマンド (CMD) キーを押しながらマウスまたはトラックパッドでスクロールします。Mac OS システムで水平方向にスクロールするには、Shift キーを押しながらマウスまたはトラックパッドでスクロールします。
- エージェントが長期間非アクティブだった場合、タイムラインにはプライマリ ステータス、セカンダリ ステータス、またはルーティング ステータスの結果は表示されません。
- 最大 7 日間のデータのみを表示できます。
- 選択した時間範囲内のインタラクション数が 200 を超える場合、上部に警告メッセージが表示され、エージェント インタラクションの詳細表示ページへのリンクが提供されます。
ビューをカスタマイズする
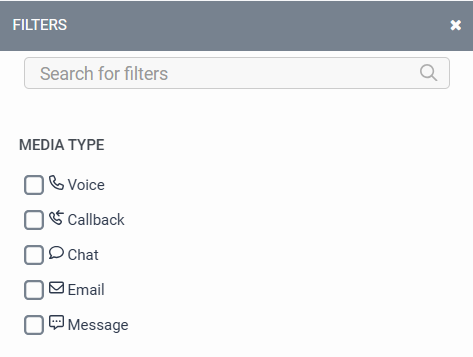
特定のデータのみを表示するには、エージェント タイムラインの詳細ビューをカスタマイズします。たとえば、特定の指標のみを表示したり、フィルタリングして特定の種類のインタラクションだけを表示したりすることができます。
アナリティクスのビューをカスタマイズするには、日付フィルタを使用します。
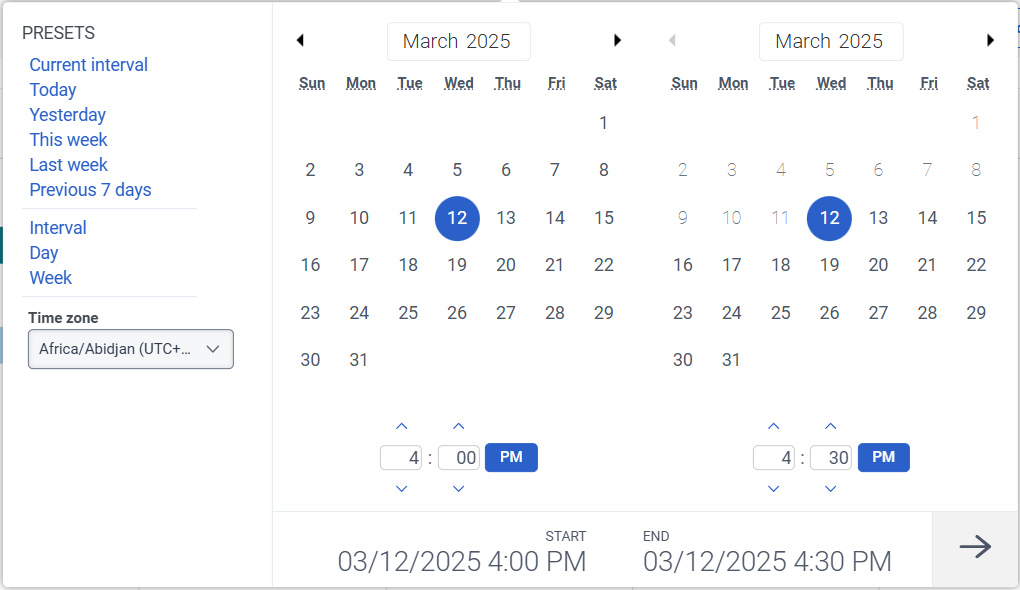
日付でメトリックをフィルタリングしたり、カスタムの日付範囲を構成したりするには、プリセットを使用します。このビューの指標をフィルタリングする場合、最大7日間までのカスタム日付範囲を選択します。
プリセットを使用してメトリックをフィルターするには、次の手順を実行します。
- 日付フィルタを表示するには、日付をクリックします。
- [プリセット]リストで、プリセットの日付オプション選択します。
日付のプリセット
| プリセット | 説明 |
|---|---|
| 現在のインターバル | 現在の30分間のデータを表示します。 |
| 今日 | 現在のインターバルを含む期間のデータを表示します。 |
| 昨日 | 前日のデータを表示します。 |
| 今週 | 日曜日から土曜日までの期間のデータを表示します。 |
| 先週 | 前週の日曜日から土曜日までのデータを表示します。 |
| 過去 7 日間 | 過去 7 日間のデータを表示します。 |
| インターバル | 30分間のデータを表示します。 |
| 日 | 1日24時間のデータを表示します。 |
| 週 | 日曜日から土曜日までの期間のデータを表示します。 |
カスタムの日付範囲を使用してメトリクスをフィルターリングするには、次の手順を実行します。
- 日付をクリックして、日付フィルターを表示します。
- カレンダーで開始日と終了日を選択し、フィルター矢印をクリックします。
同じ日付プリセットを使用して異なる期間のデータを表示するには、日付表示の両側にある矢印をクリックします。 ![]()
たとえば、前日のデータを表示するには、日プリセットをクリックし、日付の左側にある矢印をクリックします。
同じ日付プリセットを使用して異なるタイムゾーンのデータを表示するには、タイムゾーンドロップダウン メニューで、必要なタイム ゾーンを選択します。 選択した同じタイムゾーンでレポートを作成および保存できます。
要約行のメトリックを選択するには:
- クリック指標を選択。
- 必要な指標カテゴリを選択します。カウントベース、パーセンテージベース、 そして時間ベース。
- 必要なメトリックを選択します。利用可能な指標の詳細については、エージェントタイムラインの詳細ビューパフォーマンス ビューで利用可能な列をカテゴリ別に表示する記事のセクション。
注記:最大 12 個のメトリックを選択できます。 - クリック追加。選択したメトリックが表示されます。
パフォーマンスビューで利用可能なメトリックの統合リストを表示するには、パフォーマンス ビューで利用可能な列の統合ビュー。
タイムラインの行を表示または非表示にするには:
- クリック行を選択。その行を選択ポップアップウィンドウが表示されます。
- 必要な行を選択します。プライマリステータス、二次ステータス、ルーティングステータス、 そして相互作用。
- クリック確認する。選択した行は左側に表示されます。
インタラクションリストを表示または非表示にするには、インタラクションリストを表示。
選択した日付範囲のすべてのインタラクションが右側にリストされます。
インタラクションの詳細を表示するには、必要なインタラクションをクリックします。インタラクションの詳細表示ページに移動します。


