Virtual Agent performance dashboard

前提条件
  • Analytics > summaryAggregate > View
  • Analytics > Bot Aggregate > View
  • アナリティクス> ナレッジ・アグリゲート> ビュー
  • Analytics > Flow Aggregate > View
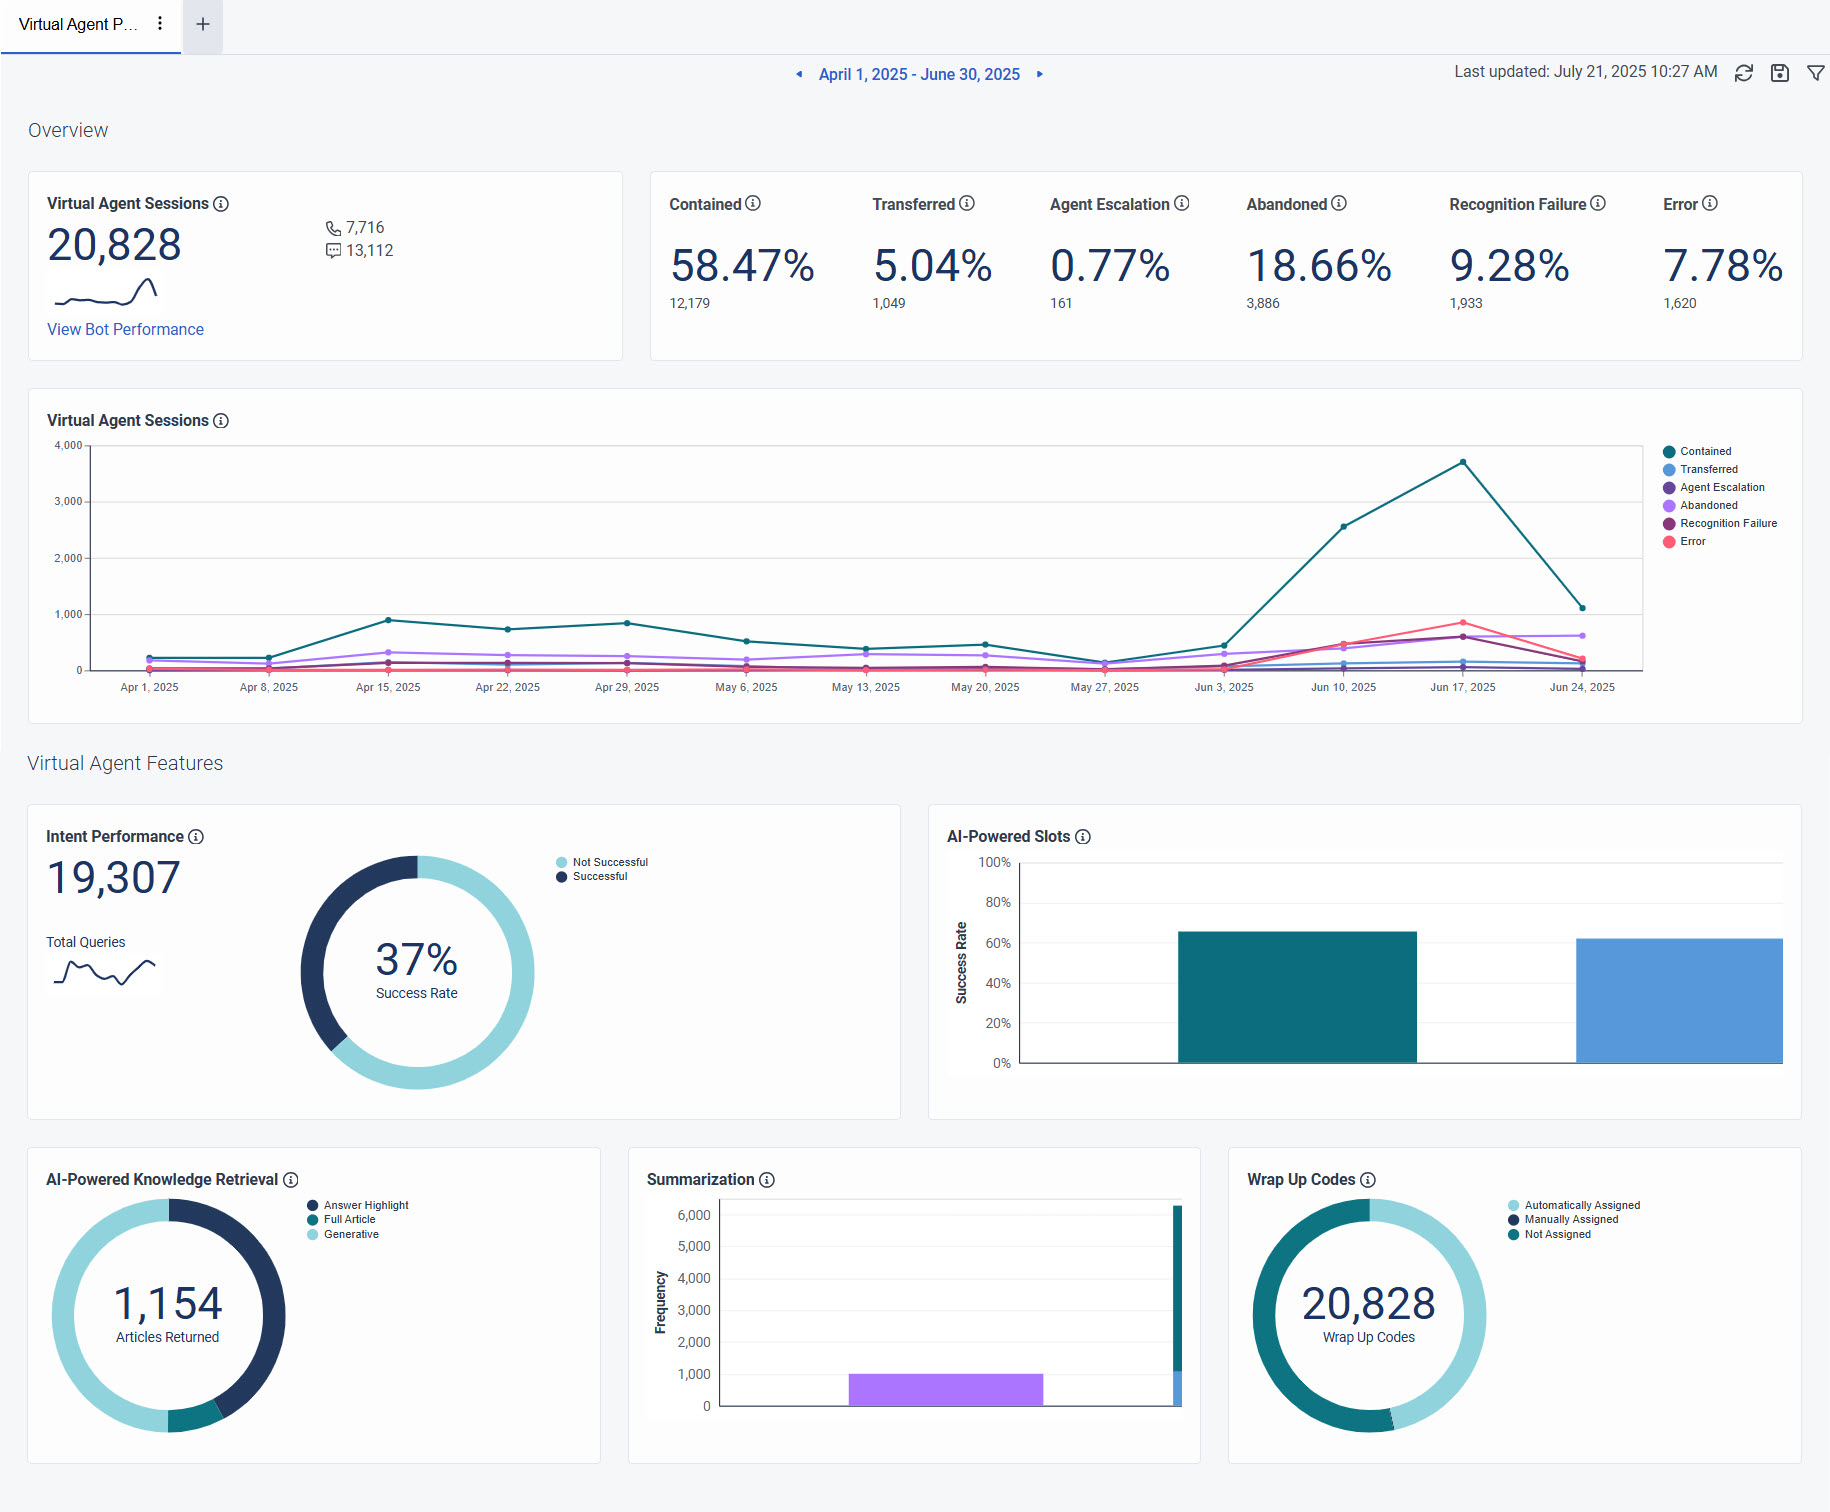
The Virtual Agent performance dashboard provides customers with comprehensive analytics and information about Virtual Agents. For more information about Genesys Virtual Agent, see About Genesys Virtual Agent. The dashboard provides a holistic view of the performance of Virtual Agents and their features, including intent performance, AI-powered slots, AI-powered knowledge retrieval, summarization, and wrap-up codes.

The dashboard provides a comprehensive view of the Key Performance Indicators (KPIs) of Virtual Agent, including the containment rate, transferred rate, agent escalation rate, abandoned rate, recognition failure rate, and error rate. This dashboard enables customers to quickly understand Virtual Agent performance, identify and address performance discrepancies, improve decision making, and increase efficiency and effectiveness. 

        To access your Virtual Agent performance dashboard, click Performance > Workspace > Other > Virtual Agent Performance

        ワークスペースにデフォルトのタイムゾーンを設定する

        分析ビューを表示する前に、分析ワークスペースでデフォルトのタイムゾーンを設定できます。

        ワークスペースでデフォルトのタイムゾーンを設定するには、次の手順に従います。

        1. パフォーマンス>ワークスペースをクリックします。
        2. 左側から、タイムゾーンドロップダウン メニューで、アナリティクス ワークスペースのデフォルトのタイム ゾーンとして必要なタイム ゾーンを選択します。

        Virtual Agent performance dashboard overview

        The dashboard gives you insights into the performance of Virtual Agents and their features.

        Virtual Agent Performance Dashboard


        最新のデータを見るには、リフレッシュ

        フィルターと列の設定でビューを保存するには保存するをクリックします。

        アナリティクスのビューをカスタマイズするには、日付フィルタを使用します。

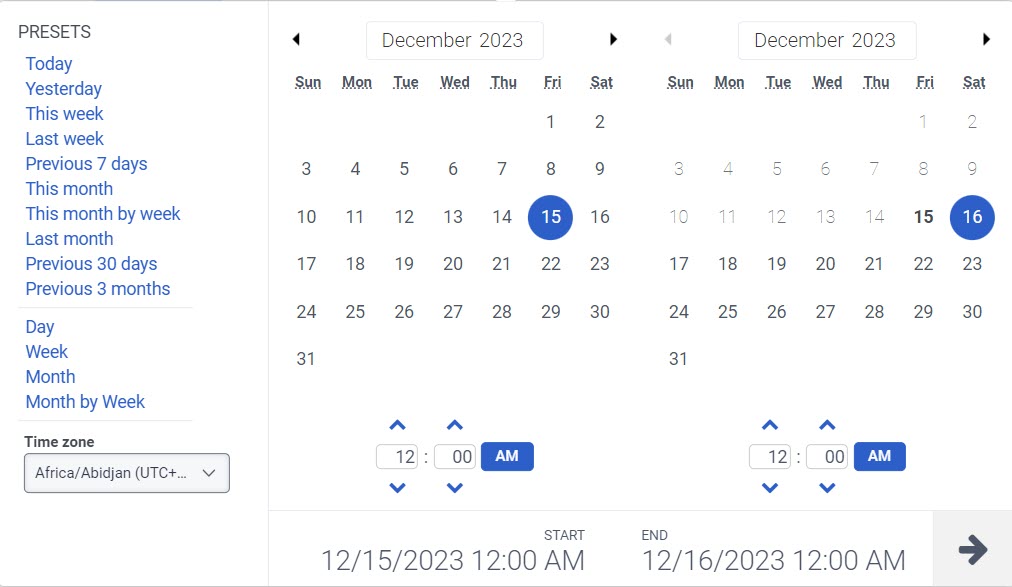
        メトリクスを日付でフィルターしたり、カスタムの日付範囲を構成したりするには、プリセットを使用します。 このビューのメトリクスをフィルタリングする場合、最大 6 週間までのカスタム日付範囲を選択します。 

        プリセットを使用してメトリックをフィルターするには、次の手順を実行します。

        1. 日付フィルタを表示するには、日付をクリックします。
        2. [プリセット]リストで、プリセットの日付オプション選択します。

        日付のプリセット

        プリセット 説明
        今日 現在のインターバルを含む期間のデータを表示します。
        昨日 前日のデータを表示します。
        今週 日曜日から土曜日までの期間のデータを表示します。
        先週 前週の日曜日から土曜日までのデータを表示します。
        過去 7 日間 過去 7 日間のデータを表示します。
        今月 現在の月のデータを表示します。余分な日はありません。
        週別に今月 日曜日に始まり土曜日に終わる現在の暦月のデータを表示します。月が日曜日に始まらないか土曜日に終わらない場合は、余分な日を含みます。
        先月 前の暦月のデータを追加日なしで表示します。
        過去 30 日間 過去30日間のデータを表示します。
        過去 3 か月 過去3か月間のデータを表示します。例えば、 2022年11月1日~2023年1月31日。
        1日24時間のデータを表示します。
        日曜日から土曜日までの期間のデータを表示します。
        追加日なしで正確な月のデータを表示します。 現在の月を選択すると、現在の日付までのデータが表示されます。
        週別の月 日曜日に始まり土曜日に終わる暦月のデータを表示します。月が日曜日に始まらないか土曜日に終わらない場合は、余分な日を含みます。

        カスタムの日付範囲を使用してメトリクスをフィルターリングするには、次の手順を実行します。

        1. 日付をクリックして、日付フィルターを表示します。
        2. カレンダーで開始日と終了日を選択し、フィルター矢印をクリックします。

        同じ日付プリセットを使用して異なる期間のデータを表示するには、日付表示の両側にある矢印をクリックします。

        たとえば、前日のデータを表示するには、プリセットをクリックし、日付の左側にある矢印をクリックします。

        同じ日付プリセットを使用して異なるタイムゾーンのデータを表示するには、タイムゾーンドロップダウン メニューで、必要なタイム ゾーンを選択します。 選択した同じタイムゾーンでレポートを作成および保存できます。

        各行に日が表示されたら、行をクリックしてその日の30分間隔を表示します。

        You can filter the information by media types and message types. The supported media types are voice, chat, and message.

        To filter the information:

        1. クリックトグルフィルターパネル。 
        2. Search or scroll to select the filter you want to use. The dashboard reflects the data based on one or more filters selected.

        The Virtual Agent performance dashboard has two sections as follows:

        • 概要
        • Virtual Agent Features

        In this section, let us discuss them in detail.

        概要

        The overview section provides insights about the following:

        • Total number of Virtual Agent sessions, and the sessions broken down by voice and digital.
        • Percentage of the total number of Virtual Agent sessions broken down by containment, transferred, agent escalation, abandoned, recognition failure, and error.
        • Graphical representation of the total number of Virtual Agent sessions broken down by containment, transferred, agent escalation, abandoned, recognition failure, and error over a period.

        Virtual Agent Sessions

        A Virtual Agent session is defined as a single virtual agent session with one or more exchanges, either through digital or voice channels. The Virtual Agent Sessions widget is linked to the Bot performance view. Click View Bot Performance at the bottom of the widget to go to the Bot Performance Summary view

        Contained

        Contained is the percentage of Virtual Agent sessions resolved without:

        • Transferring using the Transfer to ACD action (Transferred).
        • Transferring to a live agent after a user’s request (Agent Escalation).
        • Abandoned sessions (Abandoned).
        • A recognition failure or error (Recognition Failure or Error).

        転送数

        Transferred is the percentage of Virtual Agent sessions transferred using the Transfer to ACD action.

        Agent Escalation

        Agent escalation is the percentage of Virtual Agent sessions transferred to a live agent after a user’s request. For example, after detecting a customer’s want to speak to an agent as “I want to speak to an agent.” For more information about the agent escalation in voice and digital bot flows, see Agent escalation in voice and digital bot flows.

        放棄

        Abandoned is the percentage of Virtual Agent sessions that expired due to user inactivity on a digital channel or where the user hung up the phone on a voice channel.

        Recognition Failure

        Recognition failure is the percentage of Virtual Agent sessions that ended due to the Virtual Agents’ inability to understand the users’ queries or the users’ inability to respond to the Virtual Agents’ after breaching the configured limit of retries.

        エラー

        Error is the percentage of Virtual Agent sessions that ended in error.

        Virtual Agent Sessions – Graph

        A Virtual Agent session shows the graphical representation of the trends of Virtual Agents sessions broken down by containment, transferred, agent escalation, abandoned, recognition failure, and error over a period. This line graph helps customers to track how user sessions are evolving with Virtual Agents.

        Virtual Agent features

        The virtual agent features section provides insights about the following:

        • Intent Performance
        • AI-Powered Slots
        • AI-Powered Knowledge Retrieval
        • 要約
        • Wrap Up Codes

        Intent Performance

        Intent Performance displays the total number of intent-related queries. It also shows the graphical representation of the success rate of the correctly matching user inputs to the intended intents. This chart helps customers to analyze the performance of the Virtual Agents in successfully recognizing and self-serving users’ queries and requests.

        AI-Powered Slots

        AI-Powered slots show the graphical representation of the frequency of usage for each AI-powered slot type, including freeform, alphanumeric, and numeric, in user interactions. You can view the success rate versus frequency when hovering over the graph. This line graph helps customers to understand the success rate of capturing customer information and validating users’ inputs using LLM-powered slots in a conversational manner.

        AI-Powered Knowledge Retrieval

        AI-Powered Knowledge Retrieval shows the graphical representation of the total number of articles returned by Virtual Agents broken down by retrieval method, including answer highlight, generative, and full article. This chart helps the customer to understand the answering capabilities of the Virtual Agent for the end customers’ questions and to assess the level of customer experience.

        要約

        Summarization shows the graphical representation of the frequency of AI-generated summaries for both contained sessions and sessions that were transferred to agents, including the total number of summaries that were successfully generated and not generated.

        Summaries are not generated if the interaction with the Virtual Agent is either too short or too long. This chart helps the customer to understand the frequency of the AI-generated summaries for both contained sessions and sessions that were transferred to an agent. On agent escalation and transfer, these summaries are displayed to the agent to allow for a more contextual handover.

        Wrap Up Codes

        Wrap Up Codes show the graphical representation of the total number of the Virtual Agent sessions and their wrap-up code assignment status broken down by the following:

        • Manually assigned — The Virtual Agent manually assigns a wrap-up code to sessions as part of a manual Set Wrapup Code action.
        • Automatically assigned — The Virtual Agent automatically assigns a wrap-up code to sessions based on the interaction itself.
        • Not assigned — The Virtual Agent does not assign a wrap-up code for the session.