
Genesys Agent Assistのパフォーマンスダッシュボード
前提条件
次のメニュー オプションにアクセスして、エージェントからダッシュボードの分析を収集します。 :
- 会話> S提案エンゲージメント>追加
- 知識>文書コンテンツのコピー>追加
- 知識>ドキュメントビュー>追加
- 知識>フィードバック>作成、表示
- 知識>検索>編集
アナリスト向けダッシュボードを表示するには、次のメニュー オプションにアクセスします。
- アナリティクス>タブコンフィギュレーション> すべてのパーミッション
- 分析>エージェントアシスト集計>ビュー
- Analytics > Conversation Aggregate > View
- Analytics > Knowledge Aggregate > View
- Analytics> Flow Observation> View
- 分析>要約集計>ビュー
- Analytics > Queue Observation > View
以下のメニューオプションにアクセスし、フィルターを使用します:
- Directory > User > View
- Routing > Queue > View
- アシスタント>キュー>表示
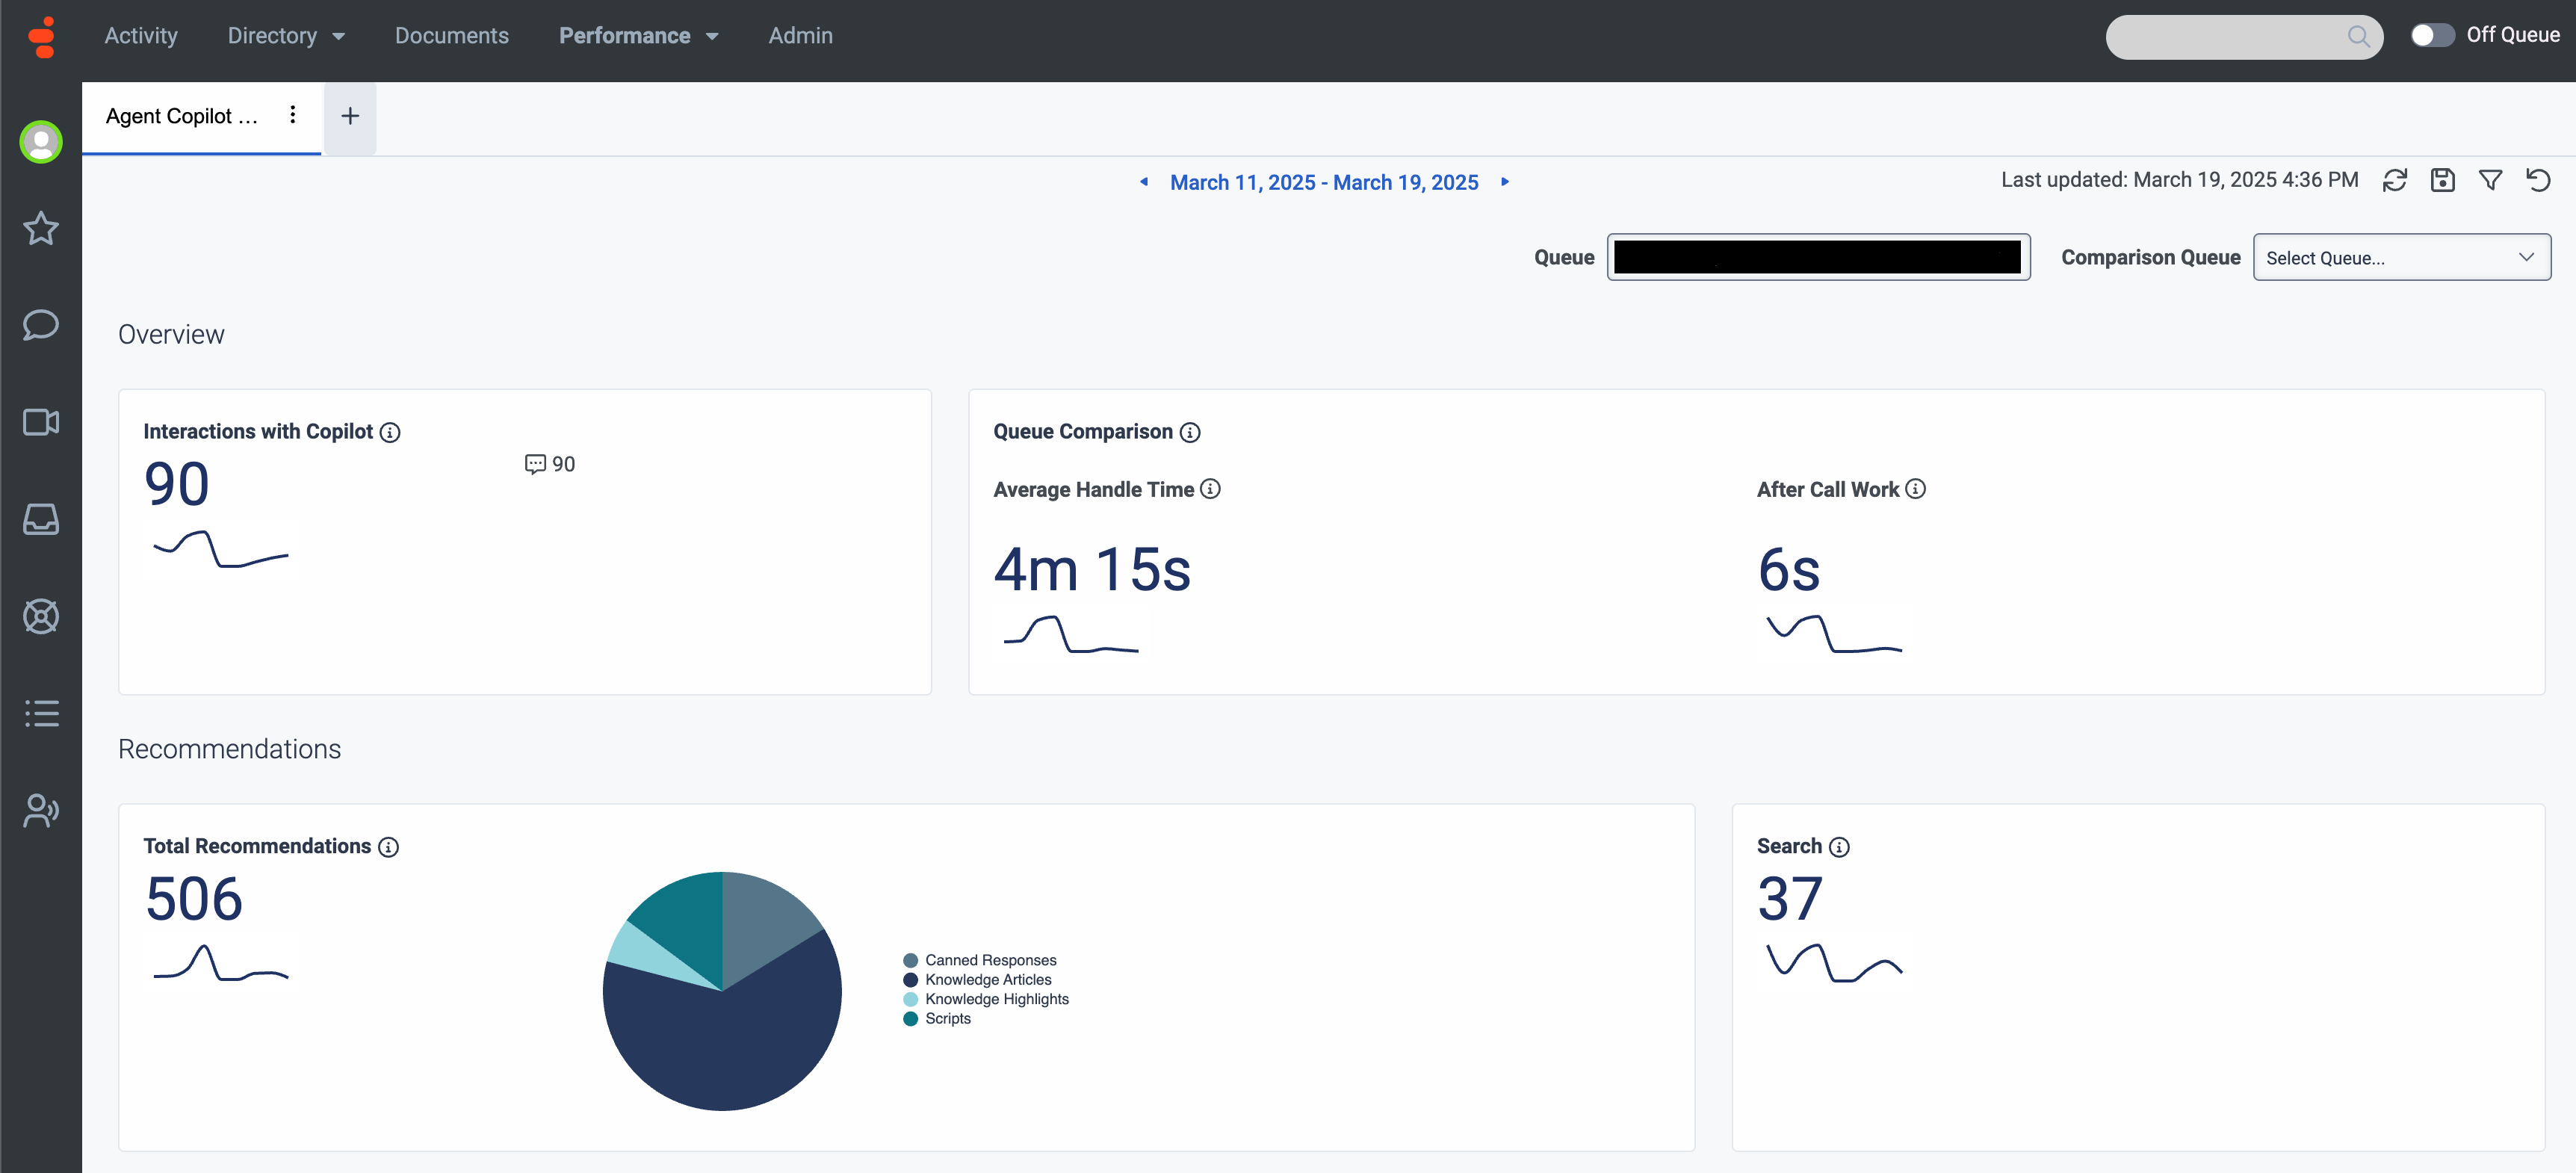
Genesys Agent Assist ダッシュボードは、インタラクションやキューのアクティビティ、通話後の作業統計など、Agent Assist 関連の機能についてより深い洞察を得るのに役立ちます。
画像をクリックして拡大します。
Genesys Agent Assistのダッシュボードにアクセスします。
- クリックパフォーマンス>ワークスペース。
- クリックメニュー > 分析>分析ワークスペース。
- メニューからクリック分析>分析ワークスペース。
- 新しいタブを開くには、新しいタブを作成。
- ワークスペースの左側から、エージェントアシストのパフォーマンス。注記:組織がAIトークンを使用している場合は、エージェントコパイロットダッシュボードその代わり。
対応するキューを選択してください
から列ドロップダウンで、検査するキューを選択します。
- 選択したキューを別のキューと比較する場合は、比較キュー落ちる。
フィルタリング結果
いくつかのフィルターを使って結果を絞り込むことができます。
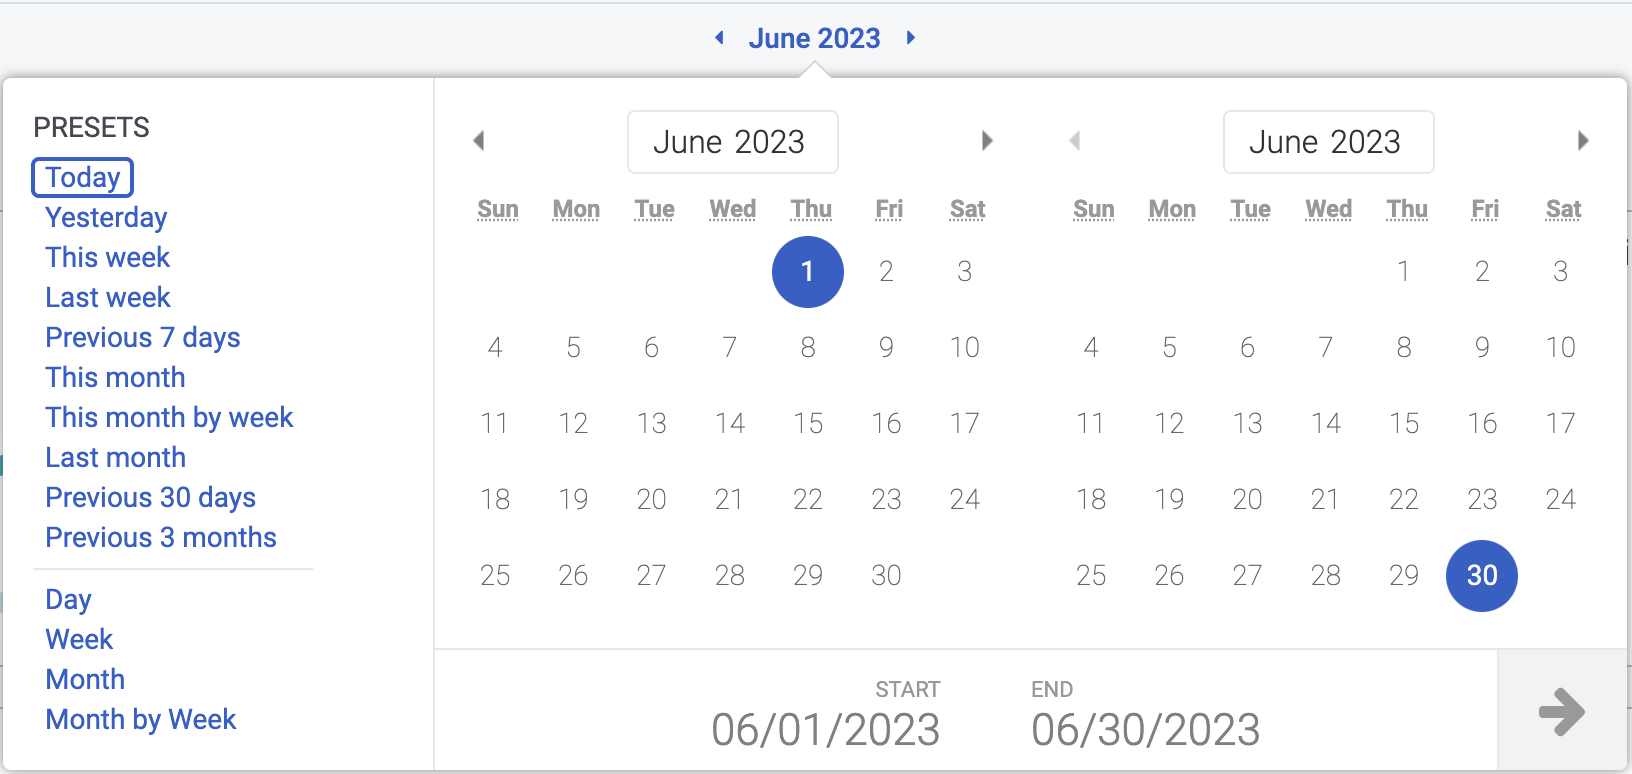
期間限定フィルター
日付セレクタを使用して、Genesys Agent Assistの分析結果を調べたい期間をフィルタリングします。
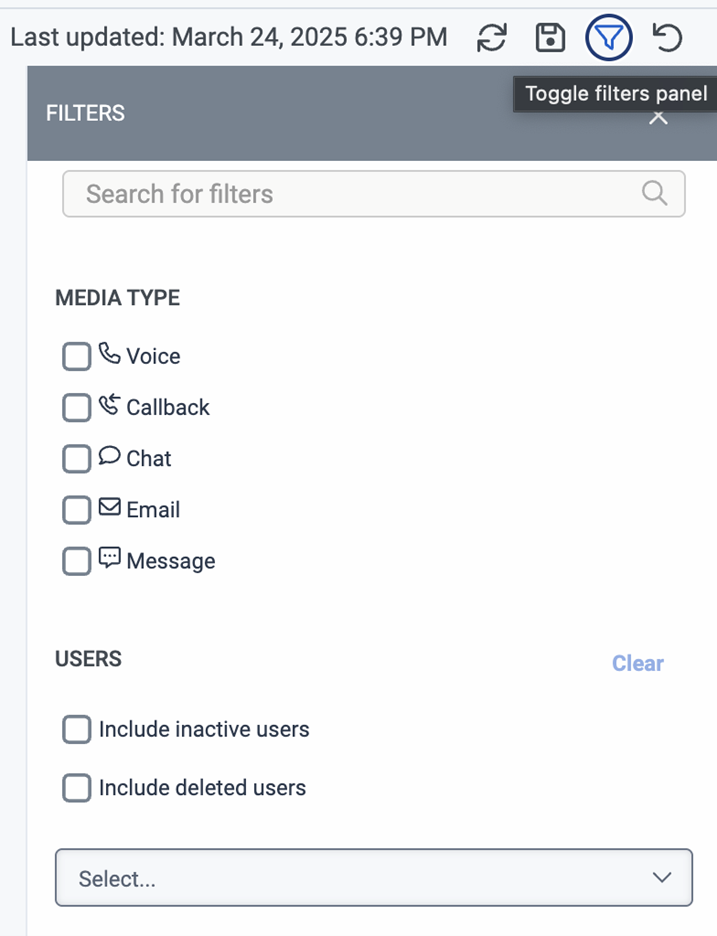
メディアタイプまたはエージェントのフィルタリング
検索フィルタを絞り込むには、フィルタアイコンをクリックします。 これらの指標をフィルタリングすることができます:
- メディアの種類(音声、コールバック、チャット、Eメール、メッセージ)
- ユーザー
Genesys Agent Assistダッシュボードの概要
この表は、ダッシュボード タイルとその機能をまとめたものです。
| タイル | 説明 |
|---|---|
| エージェントアシストとのやり取り | このタイルには、選択したキューでの Agent Assist とのインタラクションの合計数が表示されます。 |
|
キューの比較
|
|
| 合計推奨数 |
このタイルには、選択されたキューに対して Agent Assist が行った推奨事項の数が表示されます。推奨されるコンテンツ タイプごとに具体的な統計情報を確認できます。 利用可能なコンテンツタイプ
|
| 検索 | このタイルには、手動でナレッジ検索を実行した回数が表示されますエージェントアシストパネル。 |
| 推奨事項の詳細 |
このタイルには、合計推奨事項の統計に関する詳細な概要が表示されます。 各コンテンツ タイプについて、次の特性を調べることができます。
|