仮想エージェントのパフォーマンスダッシュボード
- Analytics > summaryAggregate > View
- Analytics > Bot Aggregate > View
- Analytics > Knowledge Aggregate > View
- Analytics > Flow Aggregate > View
仮想エージェント パフォーマンス ダッシュボードは、仮想エージェントに関する包括的な分析と情報をカスタマーに提供します。Genesys Virtual Agentの詳細については、以下を参照してください。 Genesys Virtual Agentについて。ダッシュボードには、インテントパフォーマンス、AI 搭載スロット、AI 搭載ナレッジ検索、要約、ラップアップ コードなど、仮想エージェントのパフォーマンスとその機能の総合的なビューが表示されます。
ダッシュボードには、封じ込め率、転送率、エージェントのエスカレーション率、放棄率、認識失敗率、エラー率など、仮想エージェントの主要業績評価指標 (KPI) の包括的なビューが表示されます。このダッシュボードにより、カスタマーは仮想エージェントのパフォーマンスを迅速に把握し、パフォーマンスの不一致を特定して対処し、意思決定を改善し、効率と有効性を高めることができます。
仮想エージェントのパフォーマンスダッシュボードにアクセスするには、パフォーマンス>ワークスペース>他の>仮想エージェントのパフォーマンス。
仮想エージェントのパフォーマンス ダッシュボードにアクセスするには、次の手順を実行します。
- クリックメニュー > 分析>分析ワークスペース。
- の中でデフォルトセクションを検索仮想エージェントのパフォーマンスビュー名をクリックして開きます。
ワークスペースにデフォルトのタイムゾーンを設定する
分析ビューを表示する前に、分析ワークスペースでデフォルトのタイムゾーンを設定できます。
ワークスペースでデフォルトのタイムゾーンを設定するには、次の手順に従います。
- パフォーマンス>ワークスペースをクリックします。
- クリックメニュー > 分析>分析ワークスペース。
- 左側から、タイムゾーンドロップダウン メニューで、アナリティクス ワークスペースのデフォルトのタイム ゾーンとして必要なタイム ゾーンを選択します。
仮想エージェントのパフォーマンスダッシュボードの概要
ダッシュボードでは、仮想エージェントのパフォーマンスとその機能に関する分析情報が得られます。
最新のデータを見るには、リフレッシュ。
フィルターと列の設定でビューを保存するには保存するをクリックします。
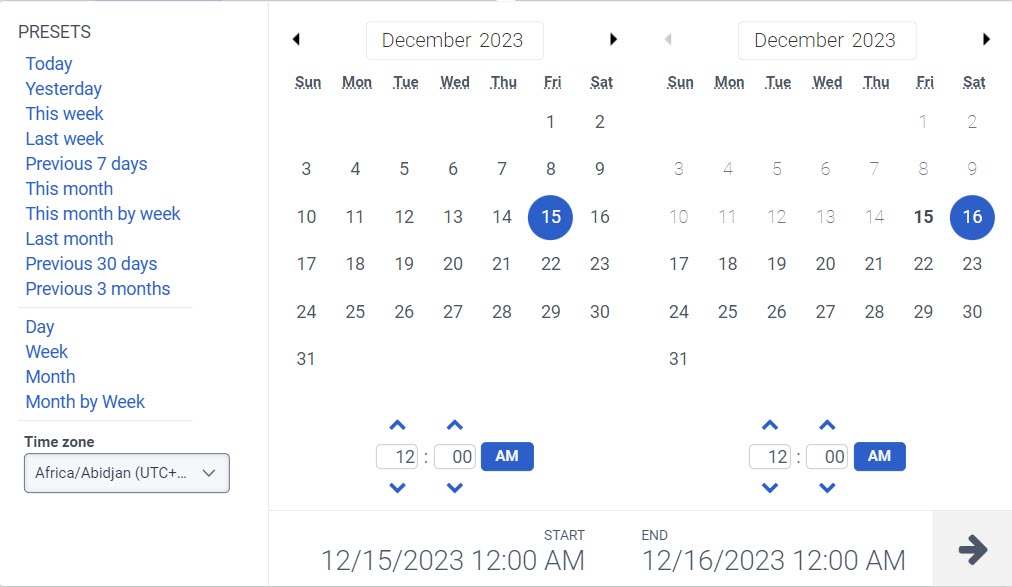
アナリティクスのビューをカスタマイズするには、日付フィルタを使用します。
メトリクスを日付でフィルターしたり、カスタムの日付範囲を構成したりするには、プリセットを使用します。 このビューのメトリクスをフィルタリングする場合、最大 6 週間までのカスタム日付範囲を選択します。
プリセットを使用してメトリックをフィルターするには、次の手順を実行します。
- 日付フィルタを表示するには、日付をクリックします。
- [プリセット]リストで、プリセットの日付オプション選択します。
日付のプリセット
| プリセット | 説明 |
|---|---|
| 今日 | 現在のインターバルを含む期間のデータを表示します。 |
| 昨日 | 前日のデータを表示します。 |
| 今週 | 日曜日から土曜日までの期間のデータを表示します。 |
| 先週 | 前週の日曜日から土曜日までのデータを表示します。 |
| 過去 7 日間 | 過去 7 日間のデータを表示します。 |
| 今月 | 現在の月のデータを表示します。余分な日はありません。 |
| 週別に今月 | 日曜日に始まり土曜日に終わる現在の暦月のデータを表示します。月が日曜日に始まらないか土曜日に終わらない場合は、余分な日を含みます。 |
| 先月 | 前の暦月のデータを追加日なしで表示します。 |
| 過去 30 日間 | 過去30日間のデータを表示します。 |
| 過去 3 か月 | 過去3か月間のデータを表示します。例えば、 2022年11月1日~2023年1月31日。 |
| 日 | 1日24時間のデータを表示します。 |
| 週 | 日曜日から土曜日までの期間のデータを表示します。 |
| 月 | 追加日なしで正確な月のデータを表示します。 現在の月を選択すると、現在の日付までのデータが表示されます。 |
| 週別の月 | 日曜日に始まり土曜日に終わる暦月のデータを表示します。月が日曜日に始まらないか土曜日に終わらない場合は、余分な日を含みます。 |
カスタムの日付範囲を使用してメトリクスをフィルターリングするには、次の手順を実行します。
- 日付をクリックして、日付フィルターを表示します。
- カレンダーで開始日と終了日を選択し、フィルター矢印をクリックします。
同じ日付プリセットを使用して異なる期間のデータを表示するには、日付表示の両側にある矢印をクリックします。 ![]()
たとえば、前日のデータを表示するには、日プリセットをクリックし、日付の左側にある矢印をクリックします。
同じ日付プリセットを使用して異なるタイムゾーンのデータを表示するには、タイムゾーンドロップダウン メニューで、必要なタイム ゾーンを選択します。 選択した同じタイムゾーンでレポートを作成および保存できます。
各行に日が表示されたら、行をクリックしてその日の30分間隔を表示します。
メディア タイプとメッセージ タイプ別に情報をフィルターできます。サポートされているメディア タイプは、音声、チャット、メッセージです。
情報をフィルタリングするには:
- クリックトグルフィルターパネル。
- 検索またはスクロールして、使用するフィルターを選択します。ダッシュボードには、選択した 1 つ以上のフィルターに基づいてデータが反映されます。
仮想エージェント パフォーマンス ダッシュボードには、次の 2 つのセクションがあります。
- 概要
- 仮想エージェントの機能
このセクションでは、それらについて詳しく説明します。
概要
概要セクションでは、次の点について説明します。
- 仮想エージェント セッションの合計数、および音声とデジタル別に分類されたセッション数。
- 仮想エージェントセッションの総数の割合(c別)封じ込め、転送、エージェントのエスカレーション、a放棄、認識失敗、エラー。
- のグラフィカルな表現仮想エージェントセッションの合計数(c別)封じ込め、転送、エージェントのエスカレーション、a一定期間内に放棄、認識失敗、エラーが発生しています。
仮想エージェントセッション
仮想エージェント セッションは、デジタル チャネルまたは音声チャネルを介した 1 つ以上のやり取りを伴う単一の仮想エージェント セッションとして定義されます。仮想エージェント セッション ウィジェットは、ボット パフォーマンス ビューにリンクされています。クリックボットのパフォーマンスを表示ウィジェットの下部にあるボットパフォーマンス概要ビュー。
封じ込められた
Contained は、以下の問題なしで解決された仮想エージェント セッションの割合です。
- ACDへの転送、ユーザーへの転送、番号への転送、またはグループへの転送アクション(転送済み)。
- ユーザーのリクエストに応じてライブエージェントに転送する(エージェントエスカレーション)。
- 放棄されたセッション(放棄された)。
- 認識失敗またはエラー(認識失敗またはエラー)。
転送数
転送済みは、ACD に転送、ユーザーに転送、番号に転送、またはグループに転送アクションを使用して転送された仮想エージェント セッションの割合です。
エージェントエスカレーション
エージェント エスカレーションは、ユーザーのリクエスト後にライブ エージェントに転送される仮想エージェント セッションの割合です。例えば、カスタマーがエージェントと話したいと「 「エージェントと話したいんです。」音声およびデジタルボットフローにおけるエージェントエスカレーションの詳細については、以下を参照してください。音声およびデジタルボットフローにおけるエージェントのエスカレーション。
放棄
放棄とは、デジタル チャネルでユーザーが非アクティブであったために期限切れになった、またはユーザーが音声チャネルで電話を切ったために期限切れになった仮想エージェント セッションの割合です。
認識失敗
認識失敗は、設定された再試行回数の制限を超えた後、仮想エージェントがユーザーのクエリを理解できないか、ユーザーが仮想エージェントのクエリに応答できないために終了した仮想エージェント セッションの割合です。
エラー
エラーは、エラーで終了した仮想エージェント セッションの割合です。
仮想エージェントセッション – グラフ
仮想エージェントセッションでは、仮想エージェントセッションの傾向をc別に分類してグラフで表示します。封じ込め、転送、エージェントエスカレーション、 1つの一定期間内に放棄、認識失敗、エラーが発生しています。この折れ線グラフは、仮想エージェントを使用してユーザー セッションがどのように進化しているかをカスタマーが追跡するのに役立ちます。
仮想エージェントの機能
仮想エージェント機能セクションでは、次の点について詳しく説明します。
- 意図的なパフォーマンス
- AI搭載スロット
- AIを活用した知識検索
- 要約
- ラップアップコード
意図的なパフォーマンス
インテント パフォーマンスには、インテント関連のクエリの合計数が表示されます。また、ユーザー入力が意図したインテントと正しく一致した成功率もグラフで表示されます。このグラフは、仮想エージェントがユーザーのクエリやリクエストを正しく認識し、セルフサービスするパフォーマンスを分析するのに役立ちます。
AI搭載スロット
AI 搭載スロットでは、ユーザーインタラクションにおける、フリーフォーム、英数字、数字などの各 AI 搭載スロットタイプの使用頻度がグラフで表示されます。はいご覧になれます成功率グラフ上にマウスを移動したときの頻度と比較します。この折れ線グラフは、会話形式で LLM 対応スロットを使用してカスタマー情報を取得し、ユーザーの入力を検証する成功率をカスタマーが理解するのに役立ちます。


