Optimize customer journeys proactively

Genesys Cloud offers an extended set of capabilities that you can use to gain insights into your customer journeys. These tools help you with the following:

  • Allows you to gain a comprehensive, multichannel view of your customer journeys.
  • Enables you to track, analyze, and optimize every step of the customer experience.
  • Provides dynamic visualizations and heat maps that reveal customer engagement levels across Architect flow components.
  • Allows for immediate insights into high-traffic areas and interactions.

With both granular and high-level views, you can use Flow Insights, Journey Flows and Replay Mode to dive into specific Architect flow components and perform the following:

  • Measure flow performance.
  • Monitor key flow milestone frequencies.
  • Understand how customers progress toward desired flow outcomes.
  • Visualize pathways customers take, capturing both successful and challenging routes.

Use Journey Management to extend your view beyond single-channel Architect flows with 365 days of cross-channel data and do the following:

  • Perform trend and funnel analysis.
  • Track journey performance over time.
  • Quickly identify shifts in your journey metrics.
  • Identify friction points in multichannel transitions.
  • Refine customer experiences.
  • Improve customer satisfaction across touchpoints.

Gain powerful insights into your customer journeys with Flow Insights

Flow Insights example in Architect

Key benefits at a glance

Get a clear view of how customers progress through your flow directly within Architect.
With a heat map representation, you can quickly identify areas with high customer engagement, as darker colors indicate denser interactions.
Hover over the highlighted Architect actions or flow components to display the exact number of times customers interacted with each of these actions or components.

Key use cases in detail

Analyze the heat map and note where the darkest interaction colors appear to pinpoint the most frequently used Architect actions and other flow components within the flow. If certain actions or components are heavily interacted with, simplify or refine these components to ensure a smoother experience, and reduce any potential friction at key points of customer interaction. High interaction counts can also indicate that customers need extra guidance or support. Add clearer instructions to address customer needs proactively.

Use the heat map to spot areas with unexpectedly high interaction counts, which could indicate bottlenecks where customers struggle or require multiple attempts. For instance, if an Architect action or menu has significantly higher interaction counts than surrounding actions, it could suggest confusion or difficulty completing that step. Investigate ways to simplify or clarify this Architect action to improve flow efficiency.
Identify flow components with low interaction counts to assess whether customers overlook these components or the components are ineffective in guiding customers. Make these components more prominent or evaluate whether they are necessary to refine the journey and ensure that each step contributes value and supports customer progression.
With the ability to see exact interaction counts on hover, you can prioritize optimizations on specific flow components that receive the highest customer engagement. For example, if an initial step shows a high interaction count but subsequent steps drop off, you can refine this first step to ensure it better prepares customers for the next stages. You also help customers to maintain engagement throughout the flow.
The heat map data allows you to discern trends in customer movement. If customers repeatedly engage with specific Architect flow components in certain ways (for example, they repeatedly return to a particular step), redesign this part of the flow and add more guidance to support a smoother journey.
Track how interaction frequencies change over time to measure the impact of optimizations. If a particular action’s interaction count drops significantly after refinement, it can indicate that the improvement successfully removed a barrier, guiding customers more effectively through the flow.

Actionable insight

  1. From the Architect home page, click or hover over the Flows menu and select the desired flow type.
  2. Click the flow that you want to analyze.
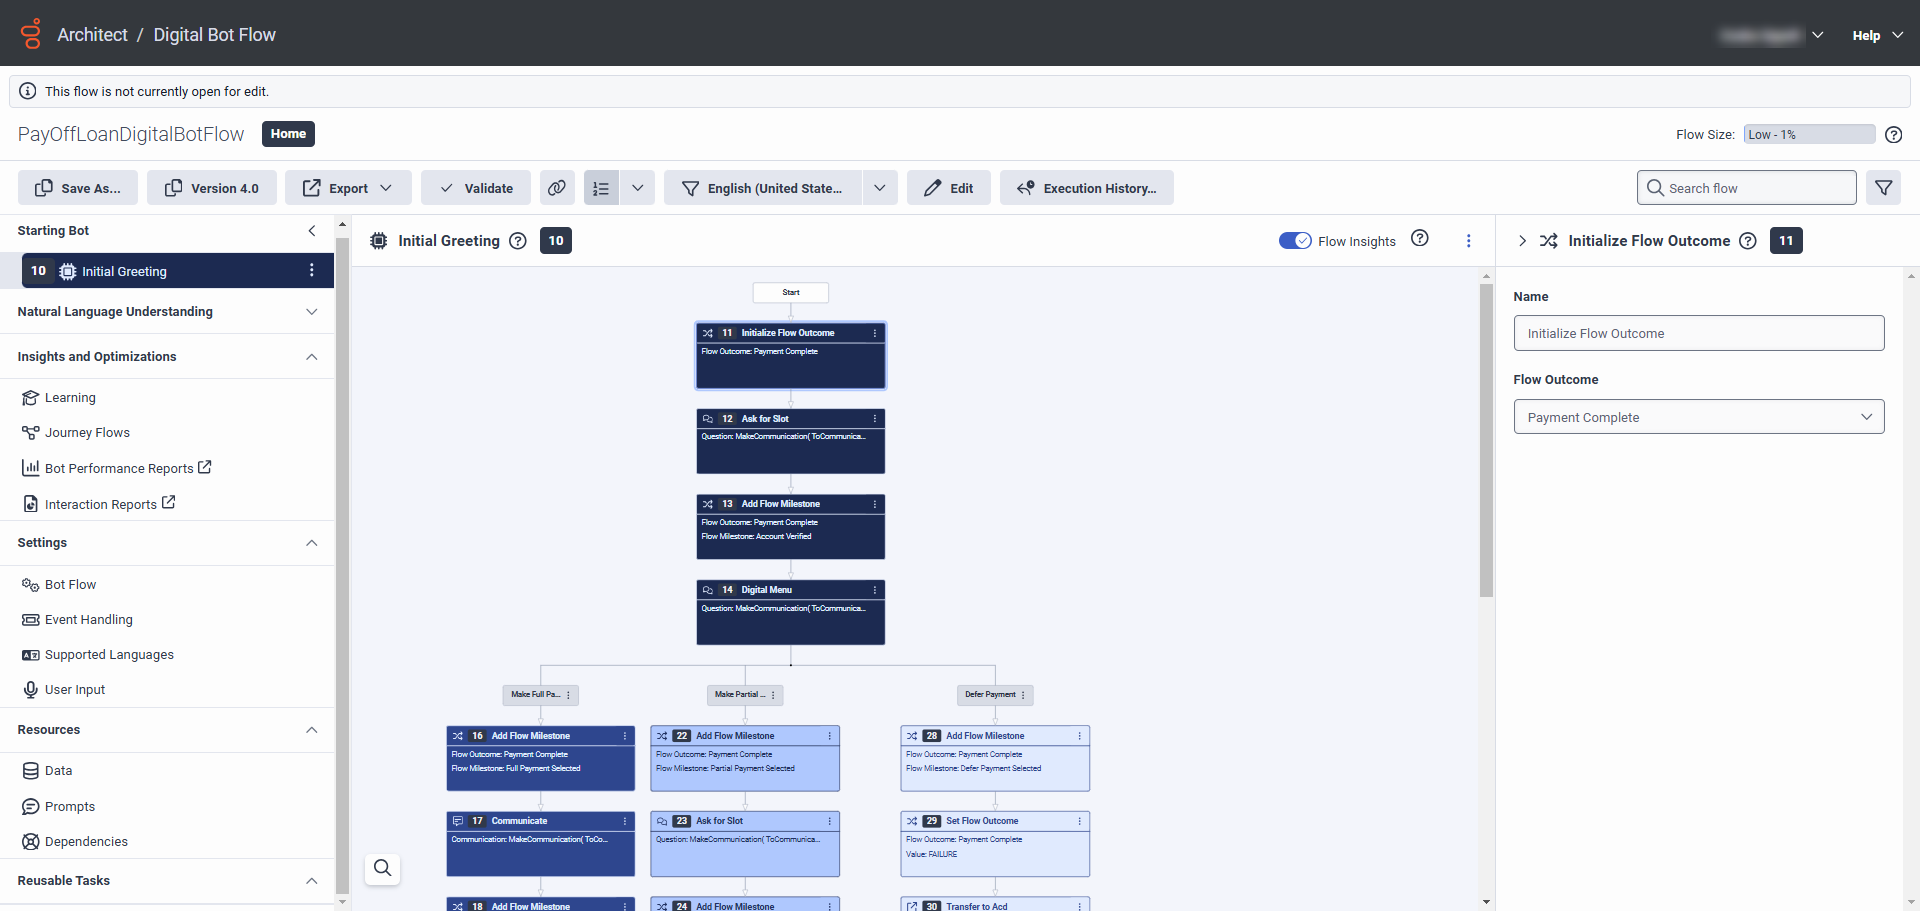
  3. Use the Flow Insights toggle to display the interaction heat map for the flow.
    Note: There must be interaction data from the past seven days for the heat map to appear.
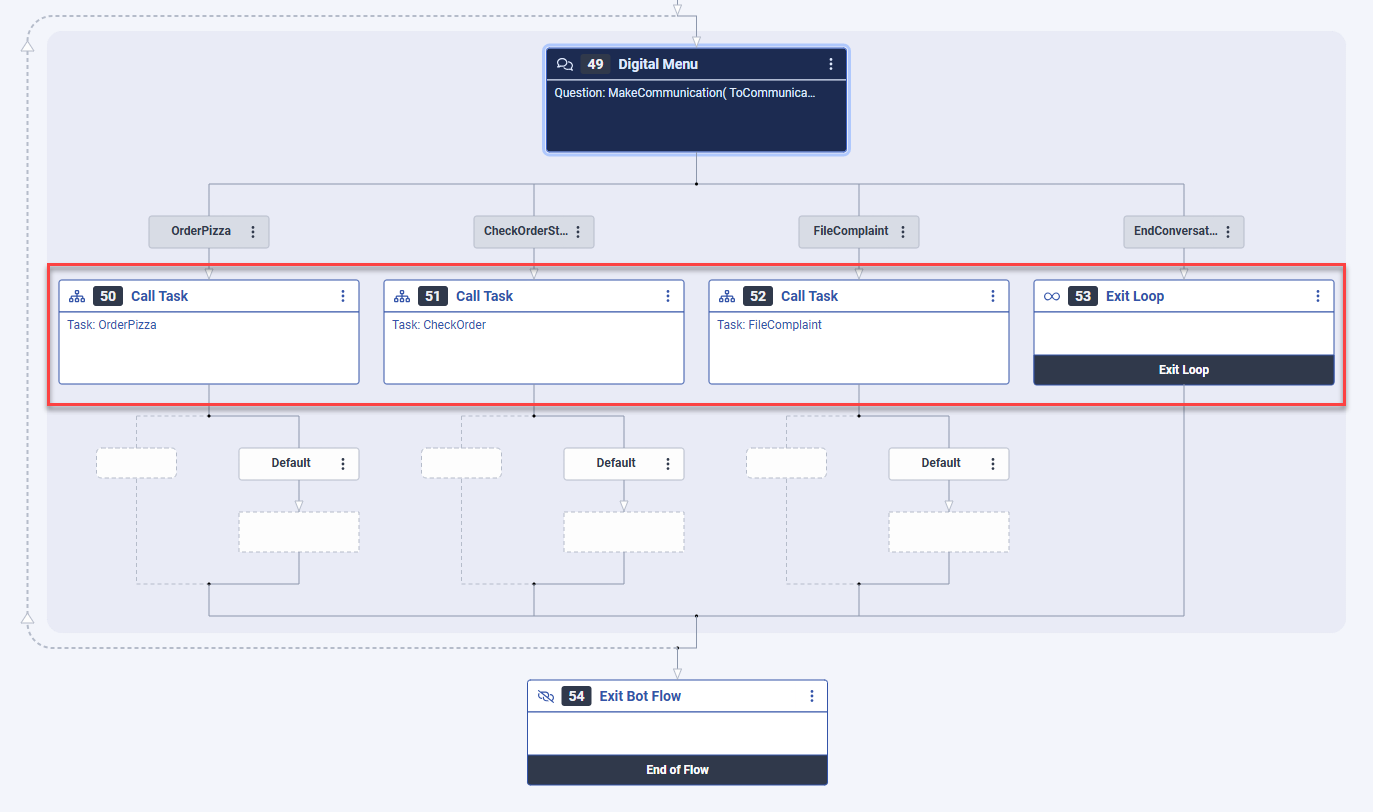
  4.  Look for flow components with high frequency (interaction count) levels and check if customers are dropping off in subsequent steps. In the following example, customers make it to the Digital Menu action in a digital bot flow, but fail to progress further:Flow Insights example of customers dropping off
  5. Now, examine the Digital Menu action to review and determine why progress is stalling and identify any necessary actions to remove the fricton points.

Gain powerful insights into your customer journeys with Journey Flows

ジャーニーフローの例

Key benefits at a glance

Get a dynamic visual representation of how users navigate through and engage with various flow segments in their customer journey.
Explore granular and high-level insights into customer behavior by drilling down into steps that customers take throughout their journey or zooming out to view broader patterns. Reveal key pathways within an Architect flow that represents a segment of the customer’s experience.
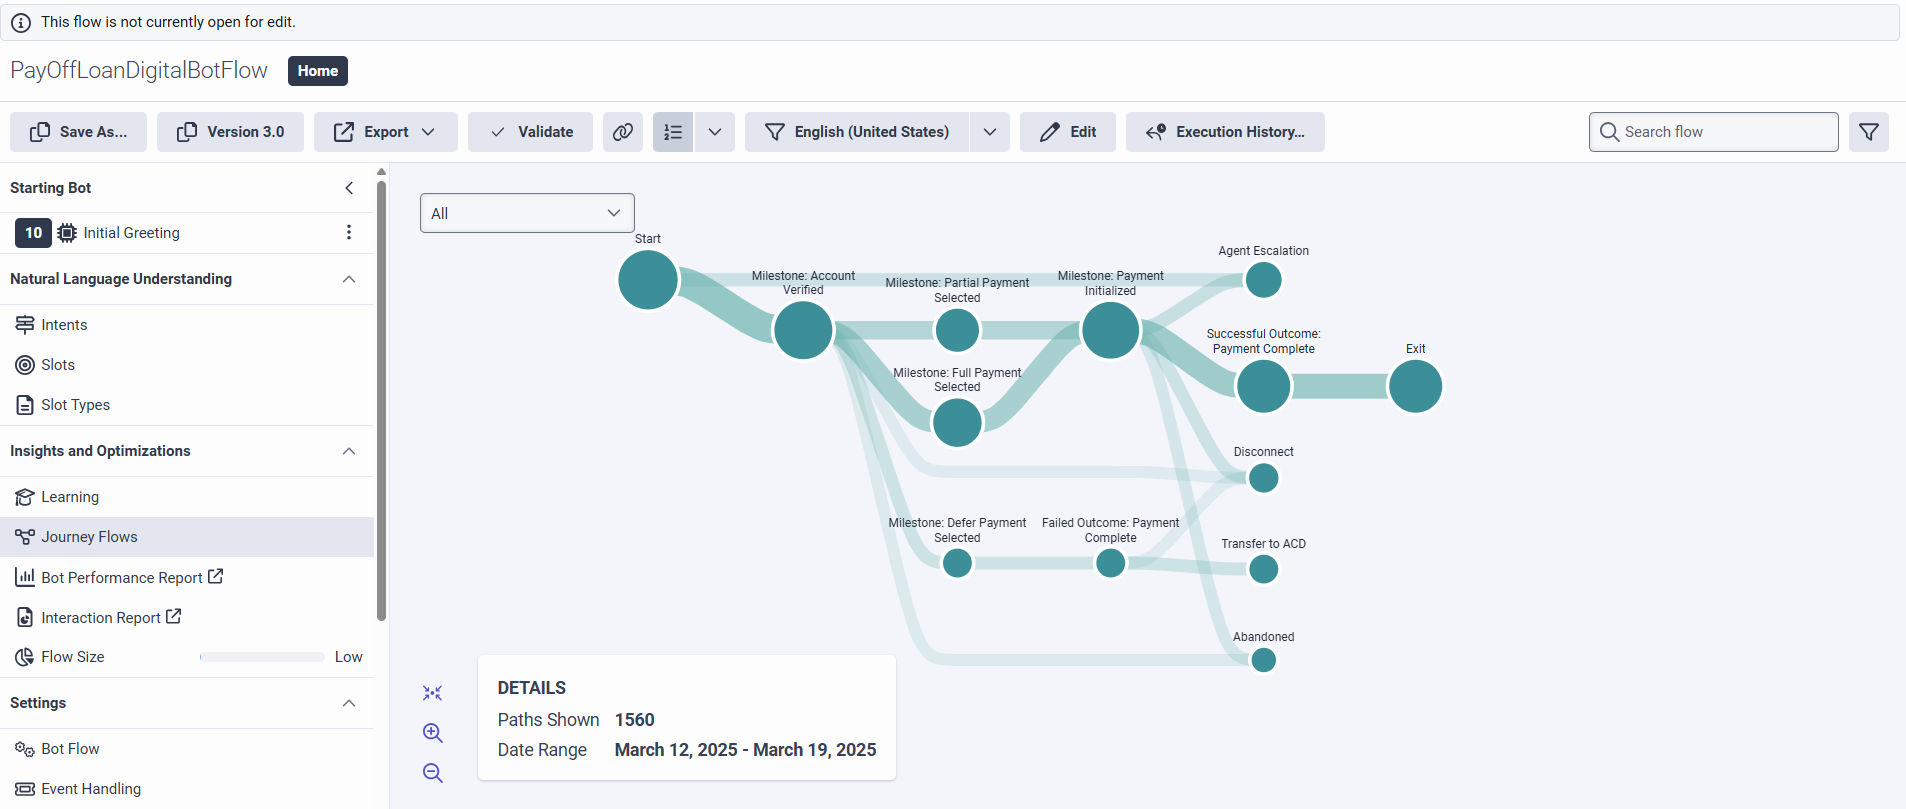
Select from various flow outcomes to generate distinct visualizations to reveal the paths customers took to reach each outcome. Outcomes include scenarios such as path abandonment, escalation to an agent, disconnection, or intent recognition failure. These paths illustrate both successful or happy routes and failure routes within the customer journey, and provide insights into a range of customer experiences.
View all flow milestones that customers reach on each journey path. Hover over specific milestones or outcomes to see the frequency counts of customer interactions. Get quick access to data on how often customers interact with particular steps to help you assess flow performance and customer engagement along the journey.

Key use cases in detail

Analyze visualizations of customer paths that lead to the abandonment outcome to identify specific milestones where a high percentage of customers drop off. If, for example, there is a high frequency of abandonments after a specific milestone, you can investigate potential friction points, such as unclear instructions, lengthy processes, or technical issues, and make adjustments to improve customer retention through this segment of the journey.
Analyze paths that end in an escalation to an agent to determine at what stages and why customers felt the need for live assistance. With these insights, you can identify opportunities to enhance self-service options, for example, by adding more guidance at specific milestones, improving automated responses, or refining knowledge articles. Such adjustments can reduce escalations and ensure that more customers achieve successful outcomes without additional support.
Focus on the happy paths where customers reach successful outcomes without any issue to identify efficient pathways. Understand the milestones that are common to these paths to simplify the customer journeys by removing or consolidating some steps to make it easier for more customers to reach successful outcomes quickly and with less effort.
Review paths that end in a disconnect or recognition failure including each step that leads up to these outcomes to detect and resolve root causes, such as limitations in recognizing customer intent or confusing interface elements. Proactively address these issues to reduce the failure rate to improve customer satisfaction and completion rates.
Use the frequency metrics at each milestone to identify high-traffic areas within the flow and prioritize optimizations for these points. Focus on these key milestones to ensure that changes impact the greatest number of customers, which can contribute to smoother, faster journeys and higher satisfaction scores across the board.
Zoom out to view broader patterns of customer movement through the Architect flow to detect common journey patterns, such as sequences of milestones reached by specific customer segments. You can use such patterns to inform personalized experiences, such as tailored prompts, shortcut options, or predictive guidance that aligns with likely next steps, and create a more intuitive and engaging customer journey.
With the frequency metrics that Architect shows on hovering over milestones or outcomes, you can make informed, data-driven decisions about where to invest optimization efforts. For instance, if a particular milestone sees heavy interaction before a drop-off, you could allocate resources to improve that specific point, and drive a targeted approach to customer journey optimization.

Actionable insight

Assume that you are a contact center admin or analyst who wants to assess the effectiveness of a bot. Your goal is to compare the number of customers who achieve resolution through the bot versus a human agent (ACD). To accomplish this task, use Journey Flows functionalities.

  1. From the Architect home page, click or hover over the Flows menu and select the desired flow type.
  2. Click the flow that you want to analyze.
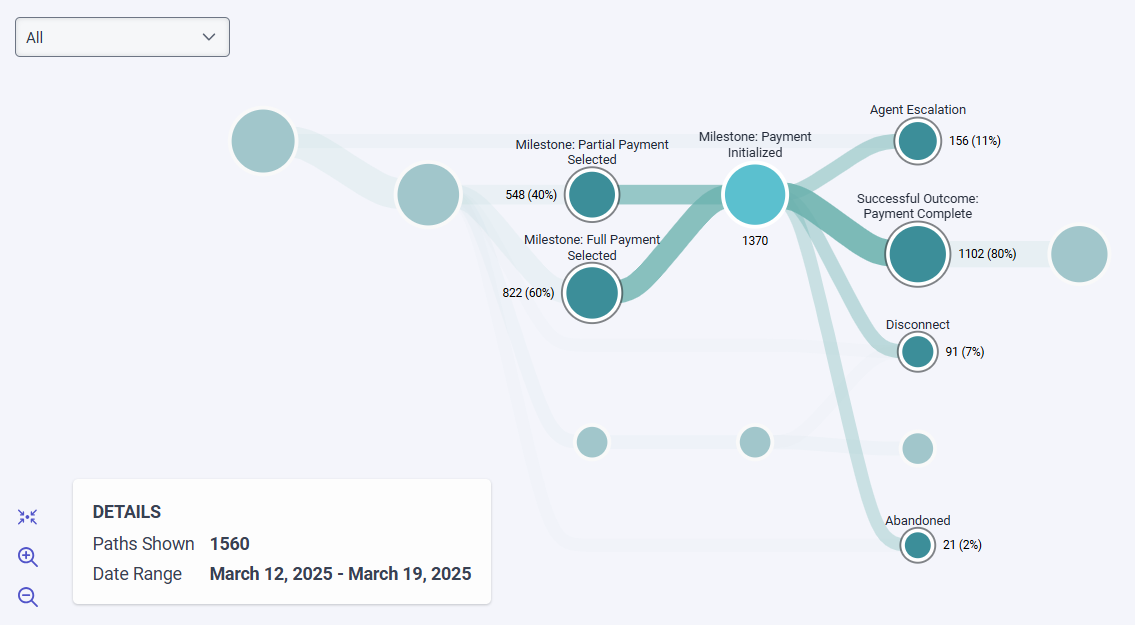
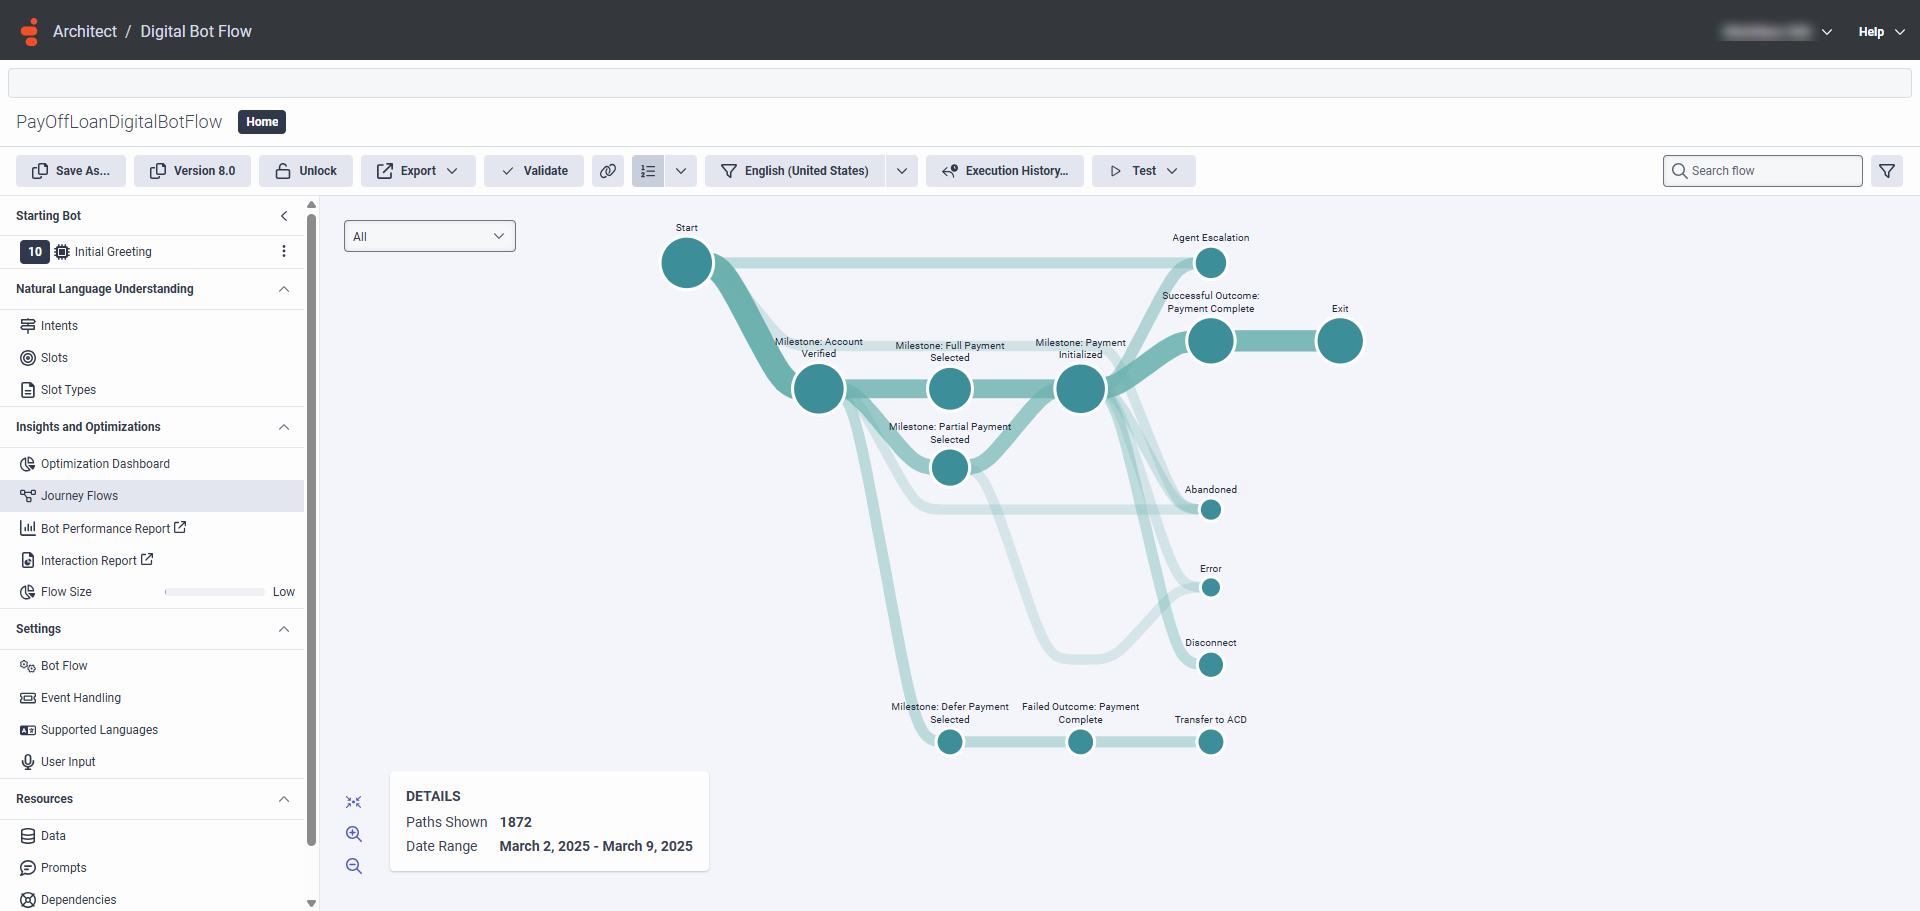
  3. Click Journey Flows in the Insights and Optimizations menu. The Journey Flows visualization opens. The visualization shows the distribution of customers along the various flow milestones and outcomes as well as the various flow exit reasons. The visualization also demonstrates how the customer journey progressed at each flow stage:
  4. Next, because you want to know how many customers went to the Payment Initialized milestone, hover over the milestone to display the frequency count:
    Journey Flows example of displaying frequency counts
    1. Now, to examine why 11 per cent of customers who completed the Payment Initialized milestone asked to speak to a human agent and seven per cent of customers disconnected the call, use Flow Insights to generate a heatmap of the Digital Menu options in your Initial Settings menu or use Replay Mode to check execution instances of your flow.
    2. Next, examine sessions that were Abandoned.


    Gain powerful insights into your customer journeys with Replay Mode:

    建築家リプレイモード

    Key benefits at a glance

    Replay past executions of your Architect flows to pinpoint low engagement and conversion issues based on insights from Flow Insights and Journey Flows.
    Test flow logic adjustments to boost engagement with key components of your Architect flow, reduce drop-offs for key flow milestones, and increase the number of customers who reach desired flow outcomes.

    Key use cases in detail

    After you identify a specific flow component with low customer engagement in Flow Insights, use Replay Mode to examine how customers interact with that flow component. Replay the steps that customers take to identify potential issues, such as confusing wording, slow response times, or missing information, that could be causing customers to disengage. Make targeted adjustments to boost engagement rates with the flow component.
    If Journey Flows shows a high drop-off rate at a specific flow milestone, replay interactions that lead to that flow milestone to see where customers are dropping off and why. For example, if customers are exiting after a specific menu choice or step, Replay Mode can reveal issues like unclear options or unmet expectations. Adjust the milestone to minimize drop-offs and retain customers in the journey.
    After you change the Architect flow’s logic, for example, you simplify steps or clarify messaging, use Replay Mode to observe if these modifications positively impact customer behavior. Compare new execution instances with previous execution instances and then confirm whether engagement rates have also improved in Flow Insights and if Journey Flows shows fewer drop-offs and more customers reaching key outcomes.
    For flow components that lead to successful outcomes, replay the customer interactions to understand better why these flow components work well. This insight can guide optimizations for other parts of the flow, and create more success paths that drive customers to desired outcomes more reliably.
    After you make improvements to the Architect flow’s logic to reduce drop-offs or increase milestone completion, replay both pre- and post-adjustment interactions. Such comparison allows you to verify if the adjustments led to a more intuitive flow. Verify the increased engagement in Flow Insights and the improved milestone progression in Journey Flows.
    For flows with multiple pathways (such as different menu options or self-service routes), use Replay Mode to track how customers navigate these choices. If certain paths show significantly lower engagement or higher drop-offs, pinpoint where customers encounter issues and make modifications to balance path effectiveness across the flow.
    If execution instances reveal frequent escalations to agents at a particular point of an Architect flow, analyze these moments to identify gaps in the self-service flow that could be causing customer frustration. Add prompts, clarify options, or improve flow responses to create a smoother self-service experience that reduces the need for agent intervention and improves journey health.

    Actionable insight

      1. From the Architect home page, click or hover over the Flows menu and select a flow type for which historical execution data is available.
      2. Open the flow that you previously executed to debug and troubleshoot.
      3. 実行履歴をクリックする。 フロー実行履歴ダイアログボックスが開きます。
      4. 結果 の下に、アーキテクトは、開いたフローの以前の実行インスタンスを一覧表示し、名前、バージョン、フロータイプ、およびフローインスタンスの開始時刻と終了時刻を提供します。
      5. フローインスタンスをクリックすると、リプレイモードでインスタンスが開きます。 詳細については、リプレイ・モードを使用したアーキテクト・フローのトラブルシューティング を参照してください。

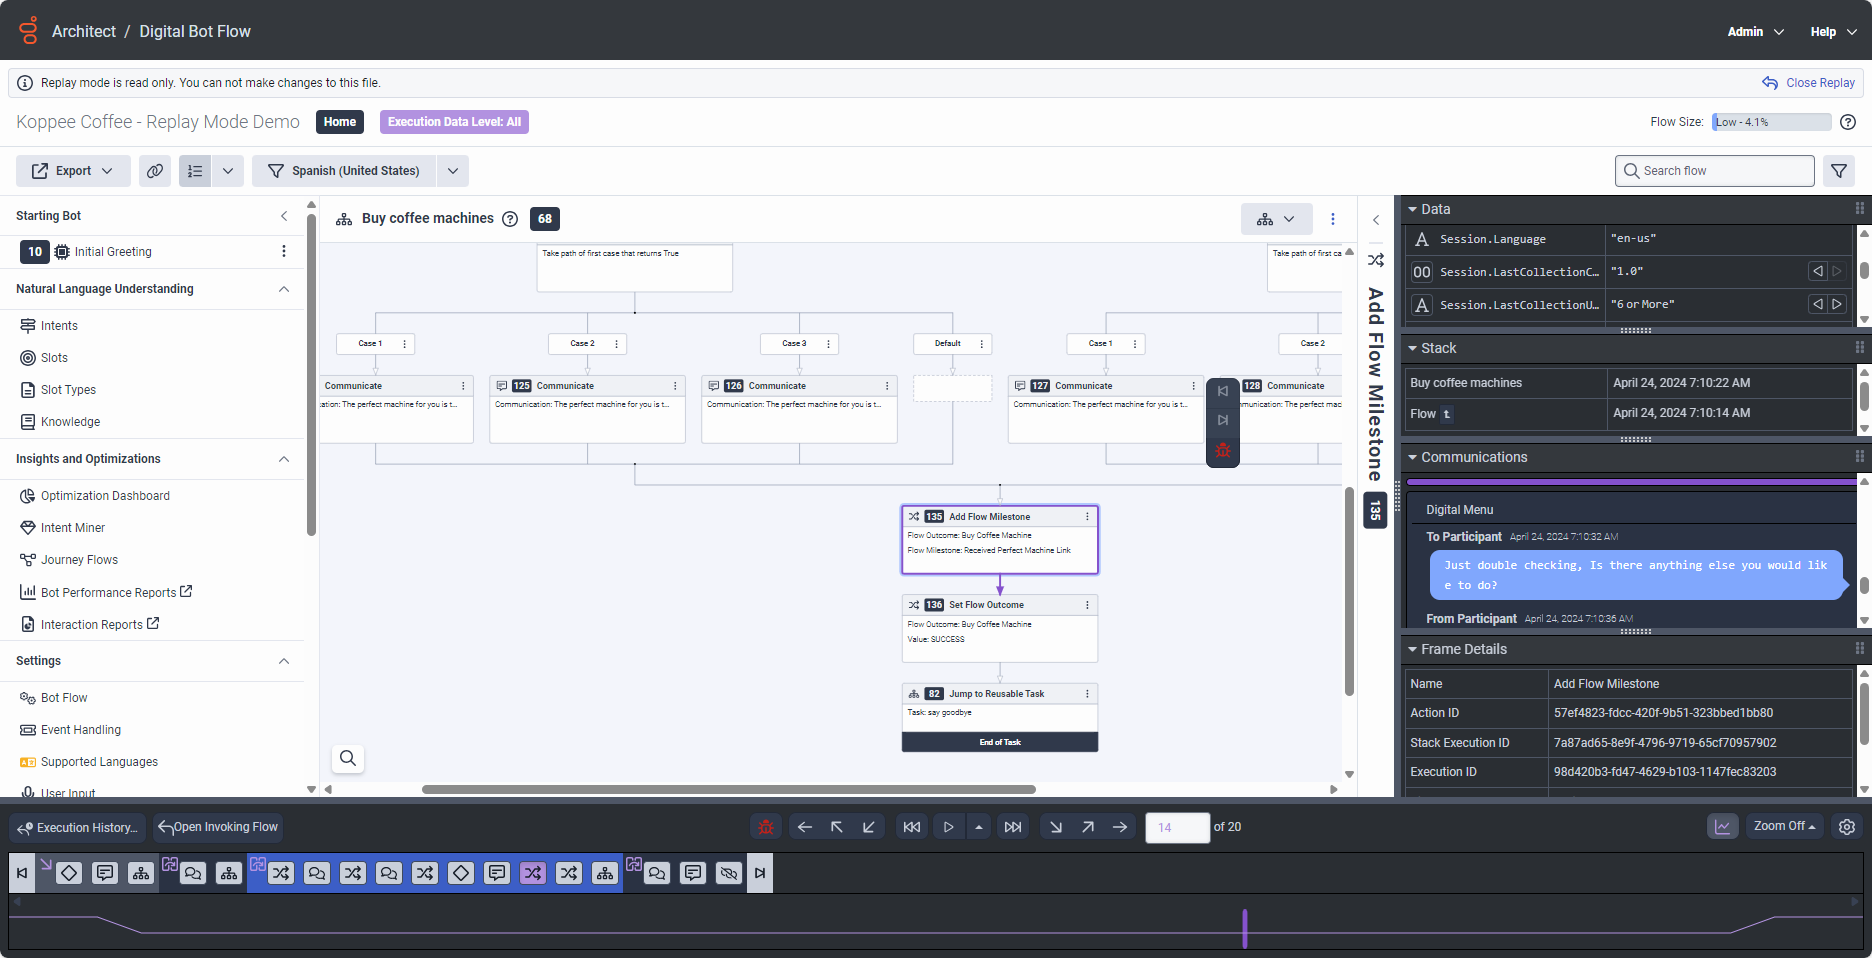
      1. Use the replay controls to step through the flow to replay the sequence of actions that lead to the specific flow component that you want to analyze. 
      2. If the required level of execution data is available, review communication exchanges and inspect variable values as well to pinpoint the issue with the flow component.

      In the following digital bot flow example, customers enter their order number to check the status of their order, but the bot fails to recognize the number.

      1. The flow designer used an Ask for Slot action to verify the order number and used a slot of the type builtin:any to store the customer’s input.
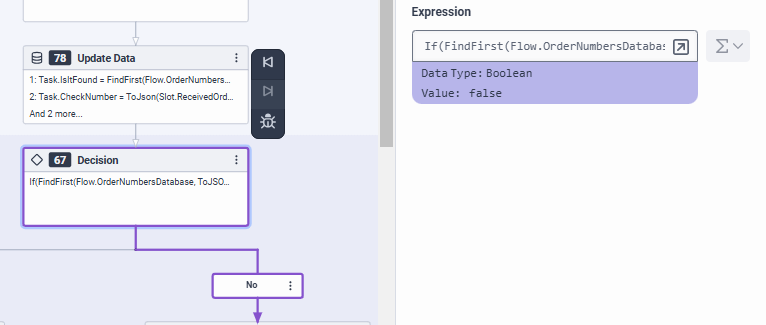
      2. After the bot receives the input, the flow moves on to a Decision action that uses the expression If(FindFirst(Flow.OrderNumbersDatabase, ToJSON(Task.CheckNumber))==-1, false, true) to determine whether the array of existing order numbers stored in the Flow.OrderNumbersDatabase variable contains the order number the customer entered (Task.CheckThisNumber).

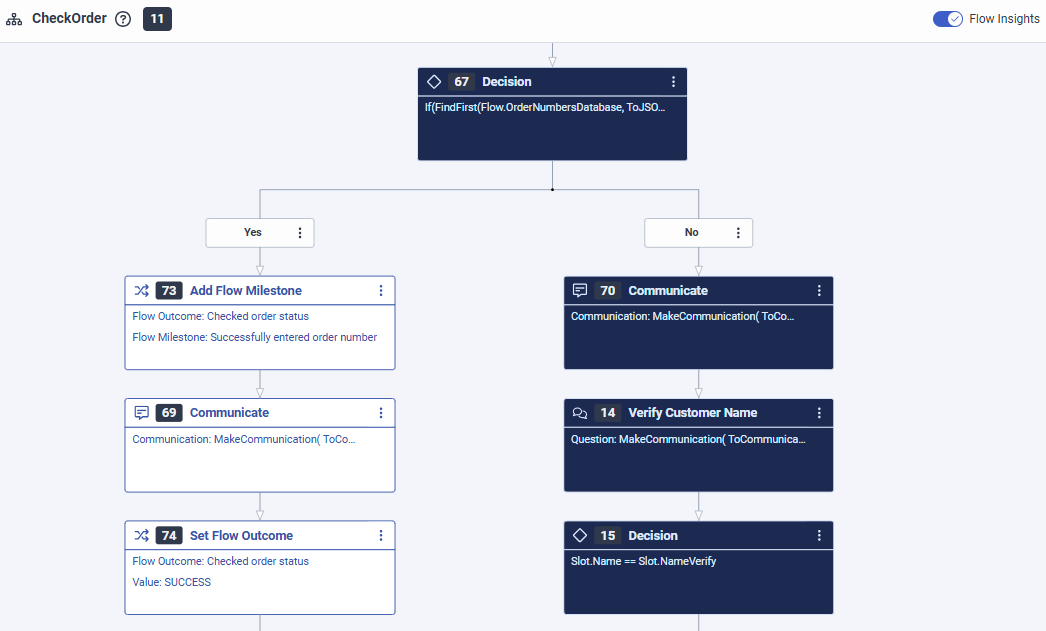
      Flow Insight’s heat map analysis shows that the Decision action always takes the unhappy path:

      Flow Insights analysis of a bot flow

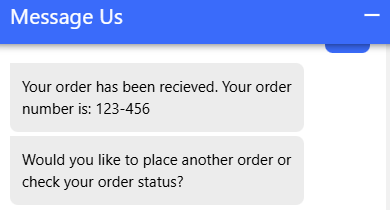
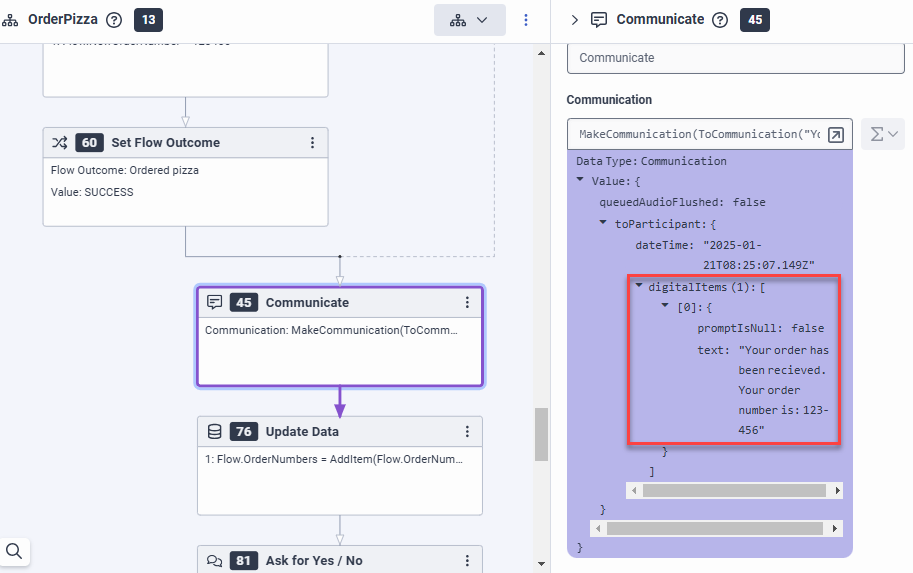
      Architect’s Replay mode provides the key to understanding why this happens. The bot uses a pattern in the format ###-### to display the order number for customers, where each # represents a digit (0–9) and - is a dash separator. The grouped format is a familiar pattern for customers that reduces the likelihood of errors compared to a long string of digits, and makes it easier to read and remember the number.

      Grouped number pattern example in a bot flow

      Replay mode analysis of a bot flow

      The recognition issue occurs because the bot provides the order number in the###-### format, but the bot expects a string of digits without dashes as user input (see the order numbers in the Flow.OrderNumbersDatabase variable). This mismatch in the flow design leads to recognition failure.

      Bot flow JSON collection example                                         Decision action in a bot flow

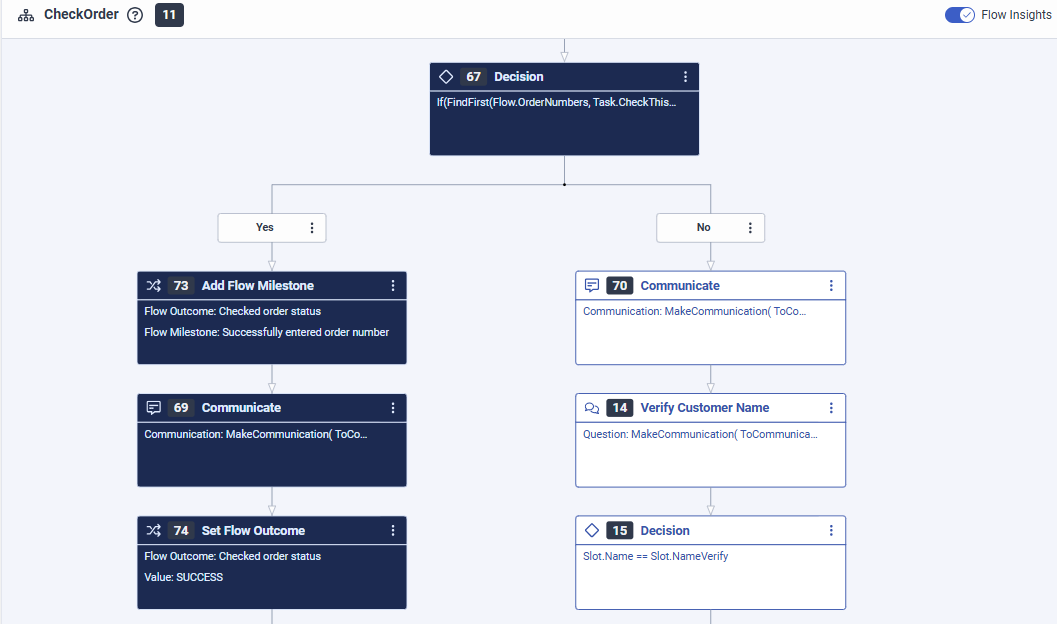
      Replay mode revealed that the bot must handle dashes in customer input. To address the recognition issue, use a regex slot type with the pattern ^\d{6}$|^\d{3}-\d{3}$ to validate the input format and remove any dashes before you check the order number against the order database.

      Decision action example in a bot flow

      Gain powerful insights into your customer journeys with Journey Management

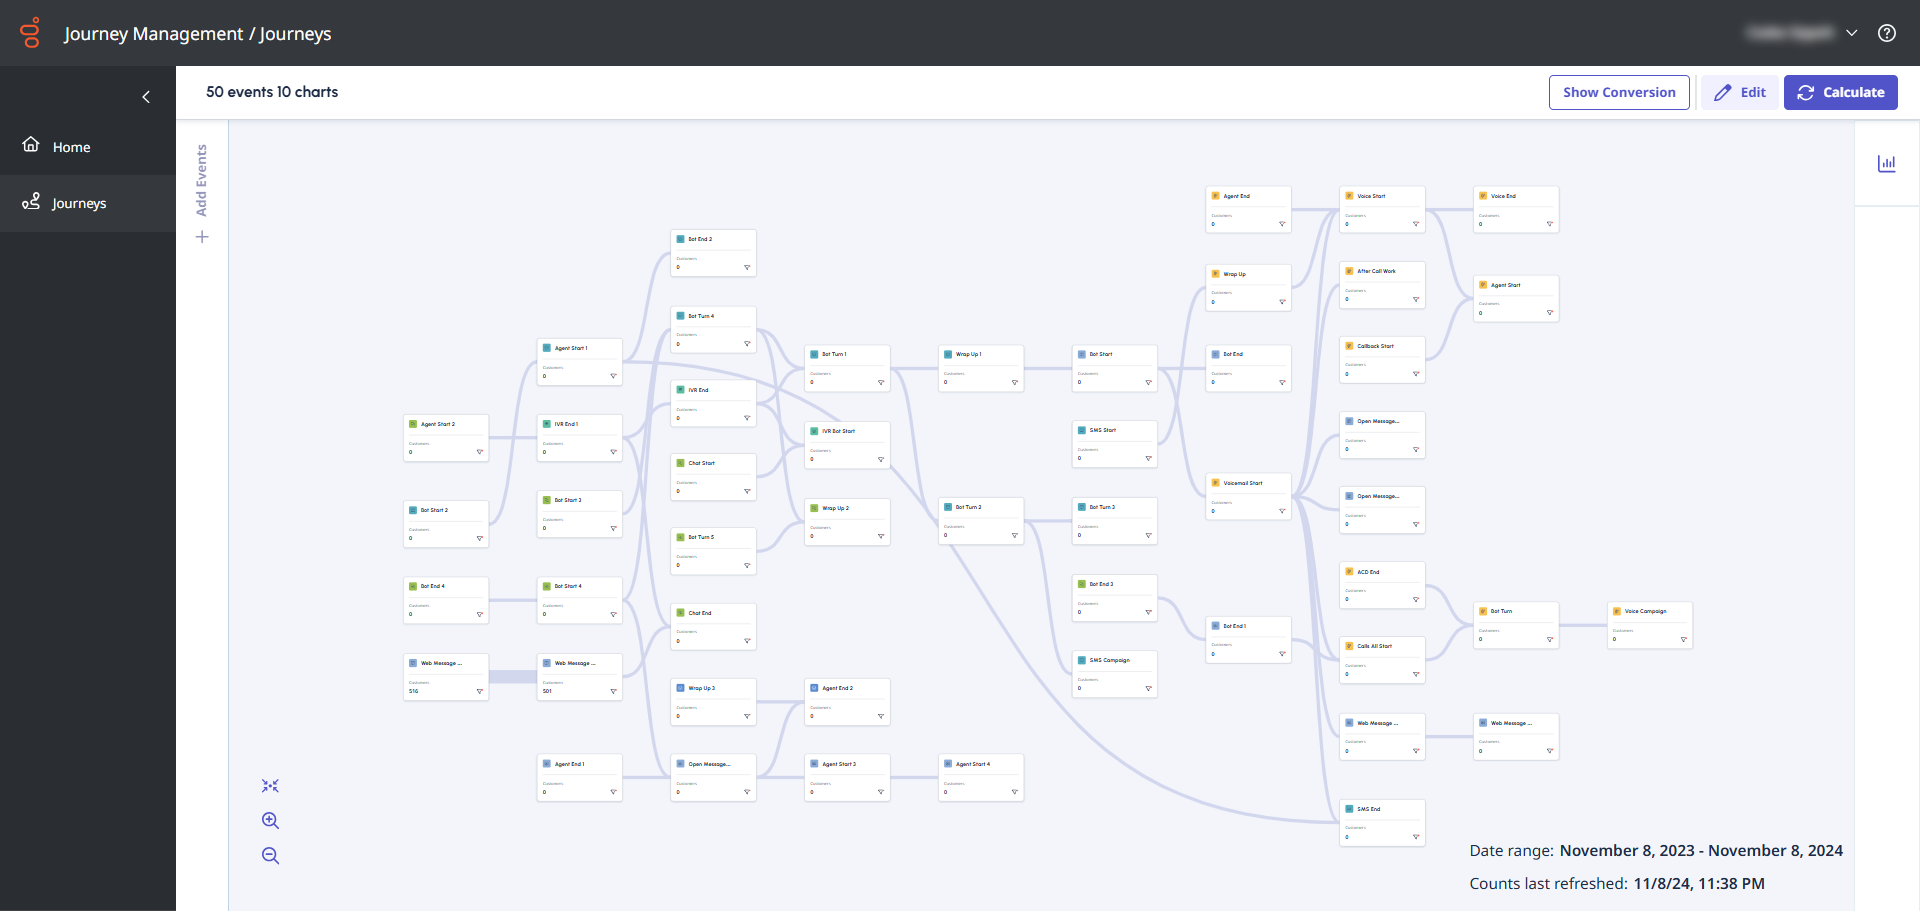
      Journey Management example

      Key benefits at a glance

      Get a customizable view of the entire end-to-end customer journey across all Genesys Cloud channels to help you understand customer interactions from initial contact to resolution.
      Extend your analysis of customer journeys beyond single-channel Architect flows, with up to 365 days of data available to track customer interactions across multiple channels and visualize long-term engagement patterns.
      View and assess specific journeys, such as customer transitions from bot interactions to agent support, across multiple channels, to understand customer needs and improve journey outcomes.
      Filter for key events, such as repeat calls within the past 24 hours, or add channels like SMS to the journey canvas, enabling a tailored view of the customer experience to drive better engagement.
      Visualize journey performance trends over time with charts and perform quick comparisons across time periods to identify shifts in metrics, such as self-service rates or escalations, for proactive issue resolution.
      Analyze customer progression across journey stages to pinpoint high-attrition points to identify and reduce friction between channels for a smoother, more effective customer experience.

      Key use cases in detail

      Visualize journeys across multiple channels to track customer interactions that span different touchpoints. For example, interactions that start with web messaging and move to a call. If customers frequently switch channels mid-journey, it could indicate that certain channels are failing to meet their needs. You can then focus on enhancing the initial channel’s functionality to reduce unnecessary channel-switching, which reduces customer effort and improves satisfaction.
      Examine customer journeys that start with a bot in a web messaging window and transition to an agent to identify points where customers experience gaps or delays in service. For example, if customers frequently contact an agent after struggling with the bot, you could refine the bot’s capabilities or adjust the transfer process to ensure a smoother transition.
      Explore how often customers move from a self-servicing interaction to an agent across different channels, such as from a web messaging interaction to a voice call. Visualize these transfers to identify if certain interactions commonly lead to escalations, suggesting areas where the customer experience might need improvements to enable more effective self-service. You can also use this analysis to make sure you transfer customers more smoothly and with the relevant context already captured to reduce the need for customers to repeat information or agents to repeat customer calls.
      You can evaluate the success rates of self-service interactions across various channels, such as digital bots across various messaging channels. By comparing the journey paths of customers who self-serviced successfully against those who required agent intervention, you can identify which self-service flows are most effective on each channel. For example, if SMS has a lower self-service completion rate than web messaging, you might suggest enhancements to the SMS flow, provide clearer prompts, or offer more resources for common issues.
      Examine which channels customers use at different points in their journey to identify trends that suggest customer preferences. For example, if customers tend to start with IVR but switch to messaging for follow-up, consider proactive messaging options after IVR interactions to better align with customer behavior and preferences to improve the journey experience.
      Visualize trends in journey performance over time with bar, line, or column charts. Compare metrics across time periods to identify changes in journey effectiveness, such as a drop in self-service rates or an increase in agent escalations. Monitor these trends to detect and address emerging issues proactively and ensure that the journey remains efficient and effective.
      Use funnel analysis to assess customer progression through various stages of their journey across channels to identify high-attrition points. For example, if many customers engage with an IVR system but fail to progress to a messaging channel for self-service, investigate potential friction points in the transition. Improve the transition between channels to maintain engagement and support successful journey progression.
      Adding multiple channels like SMS or email to the journey canvas to evaluate how these channels fit within the larger customer journey. If certain channels show low usage or effectiveness, consider ways to integrate or promote these options better to create a more comprehensive and responsive multichannel experience for customers.

      Actionable insight

      ソーシャル メディア アプリケーション用に設計されたボットの有効性を評価するコンタクト センター アナリストであると仮定します。あなたの目標は、ボットと人間のエージェントを通じて解決を達成した顧客の数を比較することです(オーストラリアCD )。このタスクを実行するには、Journey Analyzer 機能を使用します。

      1. Genesys Cloudアカウントにログインし、旅程管理メニュー。の旅程管理画面開きます。
      2. 新しい旅を創造する
      3. 入る編集モードを選択して行程を変更し、クリックします編集
      4. 旅の最初のイベントを作成するには、ソーシャル&アプリメッセージングイベントグループを選択し、ドラッグしてウェブメッセージ開始キャンバスに。
      5. 次に、どのように多くの顧客がボットスタートウェブメッセージドラッグアンドドロップボットスタートキャンバスに貼り付けて接続しますWeb メッセージの開始。
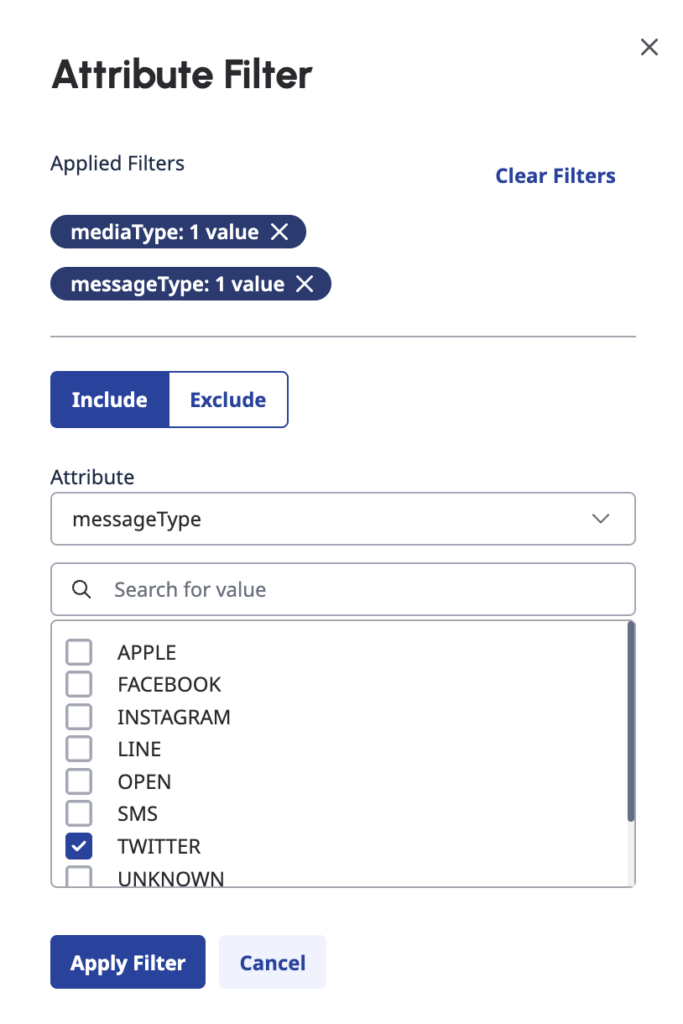
        1. イベントをボット名に絞り込むには、ボット名をイベント属性フィルター
          ヒント: ボットの名前は建築家。ジャーニー管理はネイティブまたはサードパーティのボット イベントをサポートしますが、ネイティブ ボットはジャーニーのより詳細なデータを提供します。
      6. 完了したボットセッションを確認するには、ボットエンドキャンバスに貼り付けて接続しますボットスタート
        1. Because you are interested in the same bot that you examined in Step 5, include the bot's identifier as an event attribute filter at this event.
          ヒント:ネイティブのGenesysボットを使用する場合、分析を意図やその他の関連する可能性のあるインタラクション属性に絞り込むには、ボットターン開始と終了の間。
        2. 完了したボットセッションを表示するには、 botsession結果フィルターを選択して完了属性。
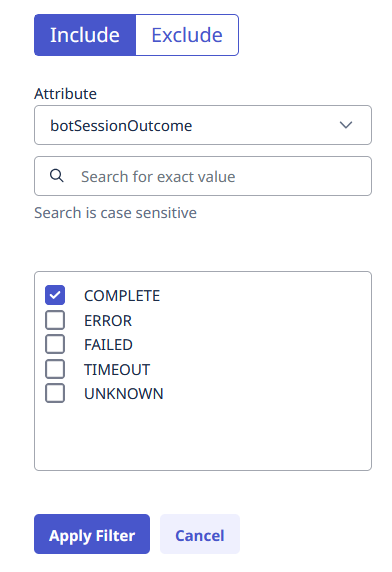
          ボットセッション結果フィルター
        3. クリックフィルターを適用
        4. このイベントでは、ACD(自動通話分配)に送られたセッションではなく、完了したボットセッションを調べます。追加するボット結果フィルター除外セクションACDへの転送値として。
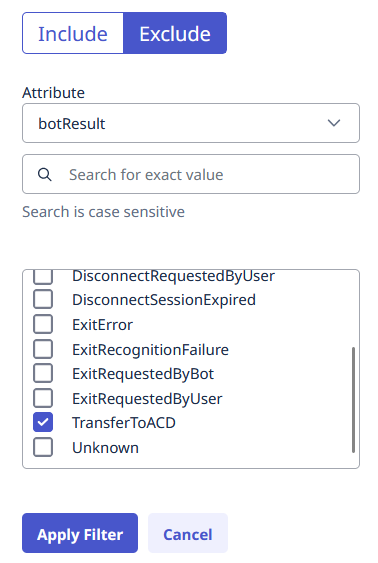
          フィルターを除外する
        5. クリックフィルターを適用
      7. 次に、ACD に行ったセッションを調べます。開くイベントグループをドラッグしてACDスタートキャンバスにイベントを追加します。接続してみましょうボットスタート、平行になるようにボットエンド
        サンプルの旅程
      8. この場合は、キューIDとして属性、そしてフィルターを追加します支払いキュー。 
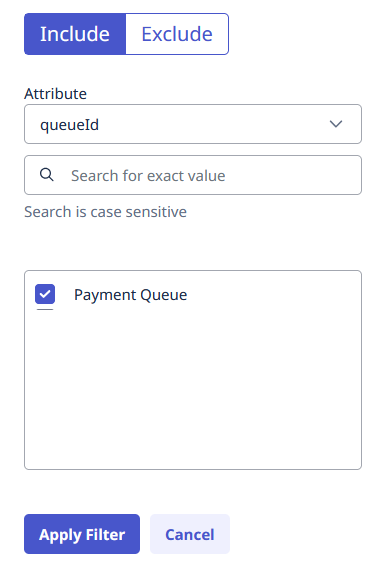
         ACD イベント フィルター
      9. クリック 保存する。 

      サンプルの旅程を計算して編集する

      1. クリック計算する旅を生み出す。計算回数に関する通知が表示されます。
      2. 続行するには、進む。計算の実行には数分かかります。読み込み時間は処理するデータの量によって異なるため、データセットが大きいほど計算に時間がかかります。結果を表示するには、ページを更新してください。
      3. 計算が終了したら、エージェントによって解決された通話の数を確認します。旅程を編集するには、編集
      4. ドラッグしてエージェント開始イベントにそれを接続しますACDスタートイベント。
        1. フィルターを追加する支払いキュー。支払いキューには 2 つのラップアップ コードがあります。 成功そして失敗
          • 成功ラップアップ コードを使用してエージェントの解決を追跡します。からイベントグループをドラッグしてまとめイベントをキャンバスに送り、エージェント開始イベント。選択してくださいwrapupコード属性と識別子を含める成功ラップアップコードをフィルターとして使用します。
            注記:はいラップアップAPIエンドポイントを使用して、環境で使用されているラップアップコードIDのリストを取得できます。 API エクスプローラーは、Genesys Cloud Developer サイトで入手できます。
          • それが成功ラップアップコード、r名前をまとめイベント。
      5. クリック 保存する。 
      6. 旅程を更新するには、計算する。更新されたカウントを確認するには、ページを更新してください。

      サンプルジャーニーのファネル分析を参照

      の助けを借りてファネル分析、 あなたはできる顧客が目標を達成するためにジャーニーをどのように進むかを理解して、個々のジャーニー パスの成功率を判断します。

      旅には欠かせない計算ファネル分析用。

      1. 分析する既存のジャーニーを開きます。 
      2. 編集モード、 クリック変換を表示。 Journey Analyzer はコンバージョン メトリックを計算します。
      3. To examine the attributed metrics, click the + icon again in the upper right corner of the event. To hide the conversion metrics of an event, click the - icon in the upper right corner.
      4. 顧客が辿った道のりを判断するには、顧客コンバージョン率ドロップそして前進それぞれのイベントにおける指標。
        :ファネル分析では、ボットスタートイベントでは、この時点で650人の顧客が旅程から脱落し、1052人の顧客が前進ボットエンド、 それでボットエンドコンバージョン率は61.7%です。これは、顧客の61.7%がボットエンドセッション。

      メモ: 
      • 常にイベントの名前を変更して、新しいユーザーがジャーニーを読み取りやすくし、シナリオに一致するようにします。
      • ジャーニー管理を使用すると、ユーザー ジャーニーに関する独自の仮説をテストできます。例えば:
        • シナリオをモデル化して、顧客がボット A を経由する場合、ボット B を経由する顧客よりも高い割合でエスカレーションするかどうかをテストできますか?複数のボットスタートジャーニーにイベントを追加し、それぞれボット A とボット B の属性フィルターを設定します。
        • 言語の影響を調べることができます。たとえば、英語を話すボットとやり取りする顧客が、フランス語を話すボットとやり取りする顧客と同じくらいうまくやり取りを完了するかどうかを測定します。この分析では、ボットスタートイベント。
        • 組織が音声に依存している場合、再エンゲージする顧客の数を測定することが一般的な使用例です。ドラッグして音声スタートイベントをキャンバスに適用し、メディアタイプ>折り返し電話フィルター。
      • 一緒に働くことができます旅の流れフロー内のパターンを表示して、調査する問題があるかどうかを確認します。たとえば、エスカレーションが見つかった場合は、Journey Analyzer を使用して、エスカレーションの性質、頻度、および結果を把握します。 
        注意:   ジャーニー管理とジャーニーフローは、互いに補完し合うことができる 2 つの強力なツールですが、いくつかの違いがあります。詳細については、ジャーニー管理とジャーニーフローの違い。 
      • パフォーマンスビューは分析をサポートするのにも役立ちます。フロー結果建築家では、キューパフォーマンスビュー、またはインタラクションビューワークスペース内。
      • アプリファウンドリー始める際に使用できるテンプレートをいくつか提供します。